

Amazon SageMaker Studio Lab is a free machine learning (ML) development environment based on open-source JupyterLab for anyone to learn and experiment with ML using AWS ML compute resources. It’s based on the same architecture and user interface as Amazon SageMaker Studio, but with a subset of Studio capabilities.
When you begin working on ML initiatives, you need to perform exploratory data analysis (EDA) or data preparation before proceeding with model building. Amazon SageMaker Data Wrangler is a capability of Amazon SageMaker that makes it faster for data scientists and engineers to prepare data for ML applications via a visual interface. Data Wrangler reduces the time it takes to aggregate and prepare data for ML from weeks to minutes.
A key accelerator of feature preparation in Data Wrangler is the Data Quality and Insights Report. This report checks data quality and helps detect abnormalities in your data, so that you can perform the required data engineering to fix your dataset. You can use the Data Quality and Insights Report to perform an analysis of your data to gain insights into your dataset such as the number of missing values and number of outliers. If you have issues with your data, such as target leakage or imbalance, the insights report can bring those issues to your attention and help you identify the data preparation steps you need to perform.
Studio Lab users can benefit from Data Wrangler because data quality and feature engineering are critical for the predictive performance of your model. Data Wrangler helps with data quality and feature engineering by giving insights into data quality issues and easily enabling rapid feature iteration and engineering using a low-code UI.
In this post, we show you how to perform exploratory data analysis, prepare and transform data using Data Wrangler, and export the transformed and prepared data to Studio Lab to carry out model building.
Solution overview
The solution includes the following high-level steps:
Create AWS account and admin user. This is a prerequisite
Download the dataset churn.csv.
Load the dataset to Amazon Simple Storage Service (Amazon S3).
Create a SageMaker Studio domain and launch Data Wrangler.
Import the dataset into the Data Wrangler flow from Amazon S3.
Create the Data Quality and Insights Report and draw conclusions on necessary feature engineering.
Perform the necessary data transforms in Data Wrangler.
Download the Data Quality and Insights Report and the transformed dataset.
Upload the data to a Studio Lab project for model training.
The following diagram illustrates this workflow.
Prerequisites
To use Data Wrangler and Studio Lab, you need the following prerequisites:
Studio Lab – For onboarding information, refer to Amazon SageMaker Studio Lab, a Free Service to Learn and Experiment with ML.
An AWS account – If you don’t have an AWS account, you can create and activate a new AWS account.
An IAM user with SageMaker permissions – For instructions on creating an AWS Identity and Access Management (IAM) user, refer to Set Up Amazon SageMaker Prerequisites.
A Studio domain – For instructions, refer to Onboard to Amazon SageMaker Domain. For more information about the domain environment, see Amazon SageMaker Machine Learning Environments.
A dataset – You can bring your own dataset or experiment with Data Wrangler using the churn.csv dataset used in this post. This is a synthetic dataset from a telecommunications mobile phone carrier for customer churn prediction.
Access to an S3 bucket – You can use the SageMaker default bucket (sagemaker-{region}-{account_id}), or create your own S3 bucket.
Build a data preparation workflow with Data Wrangler
To get started, complete the following steps:
Upload your dataset to Amazon S3.
On the SageMaker console, under Control panel in the navigation pane, choose Studio.
On the Launch app menu next to your user profile, choose Studio.
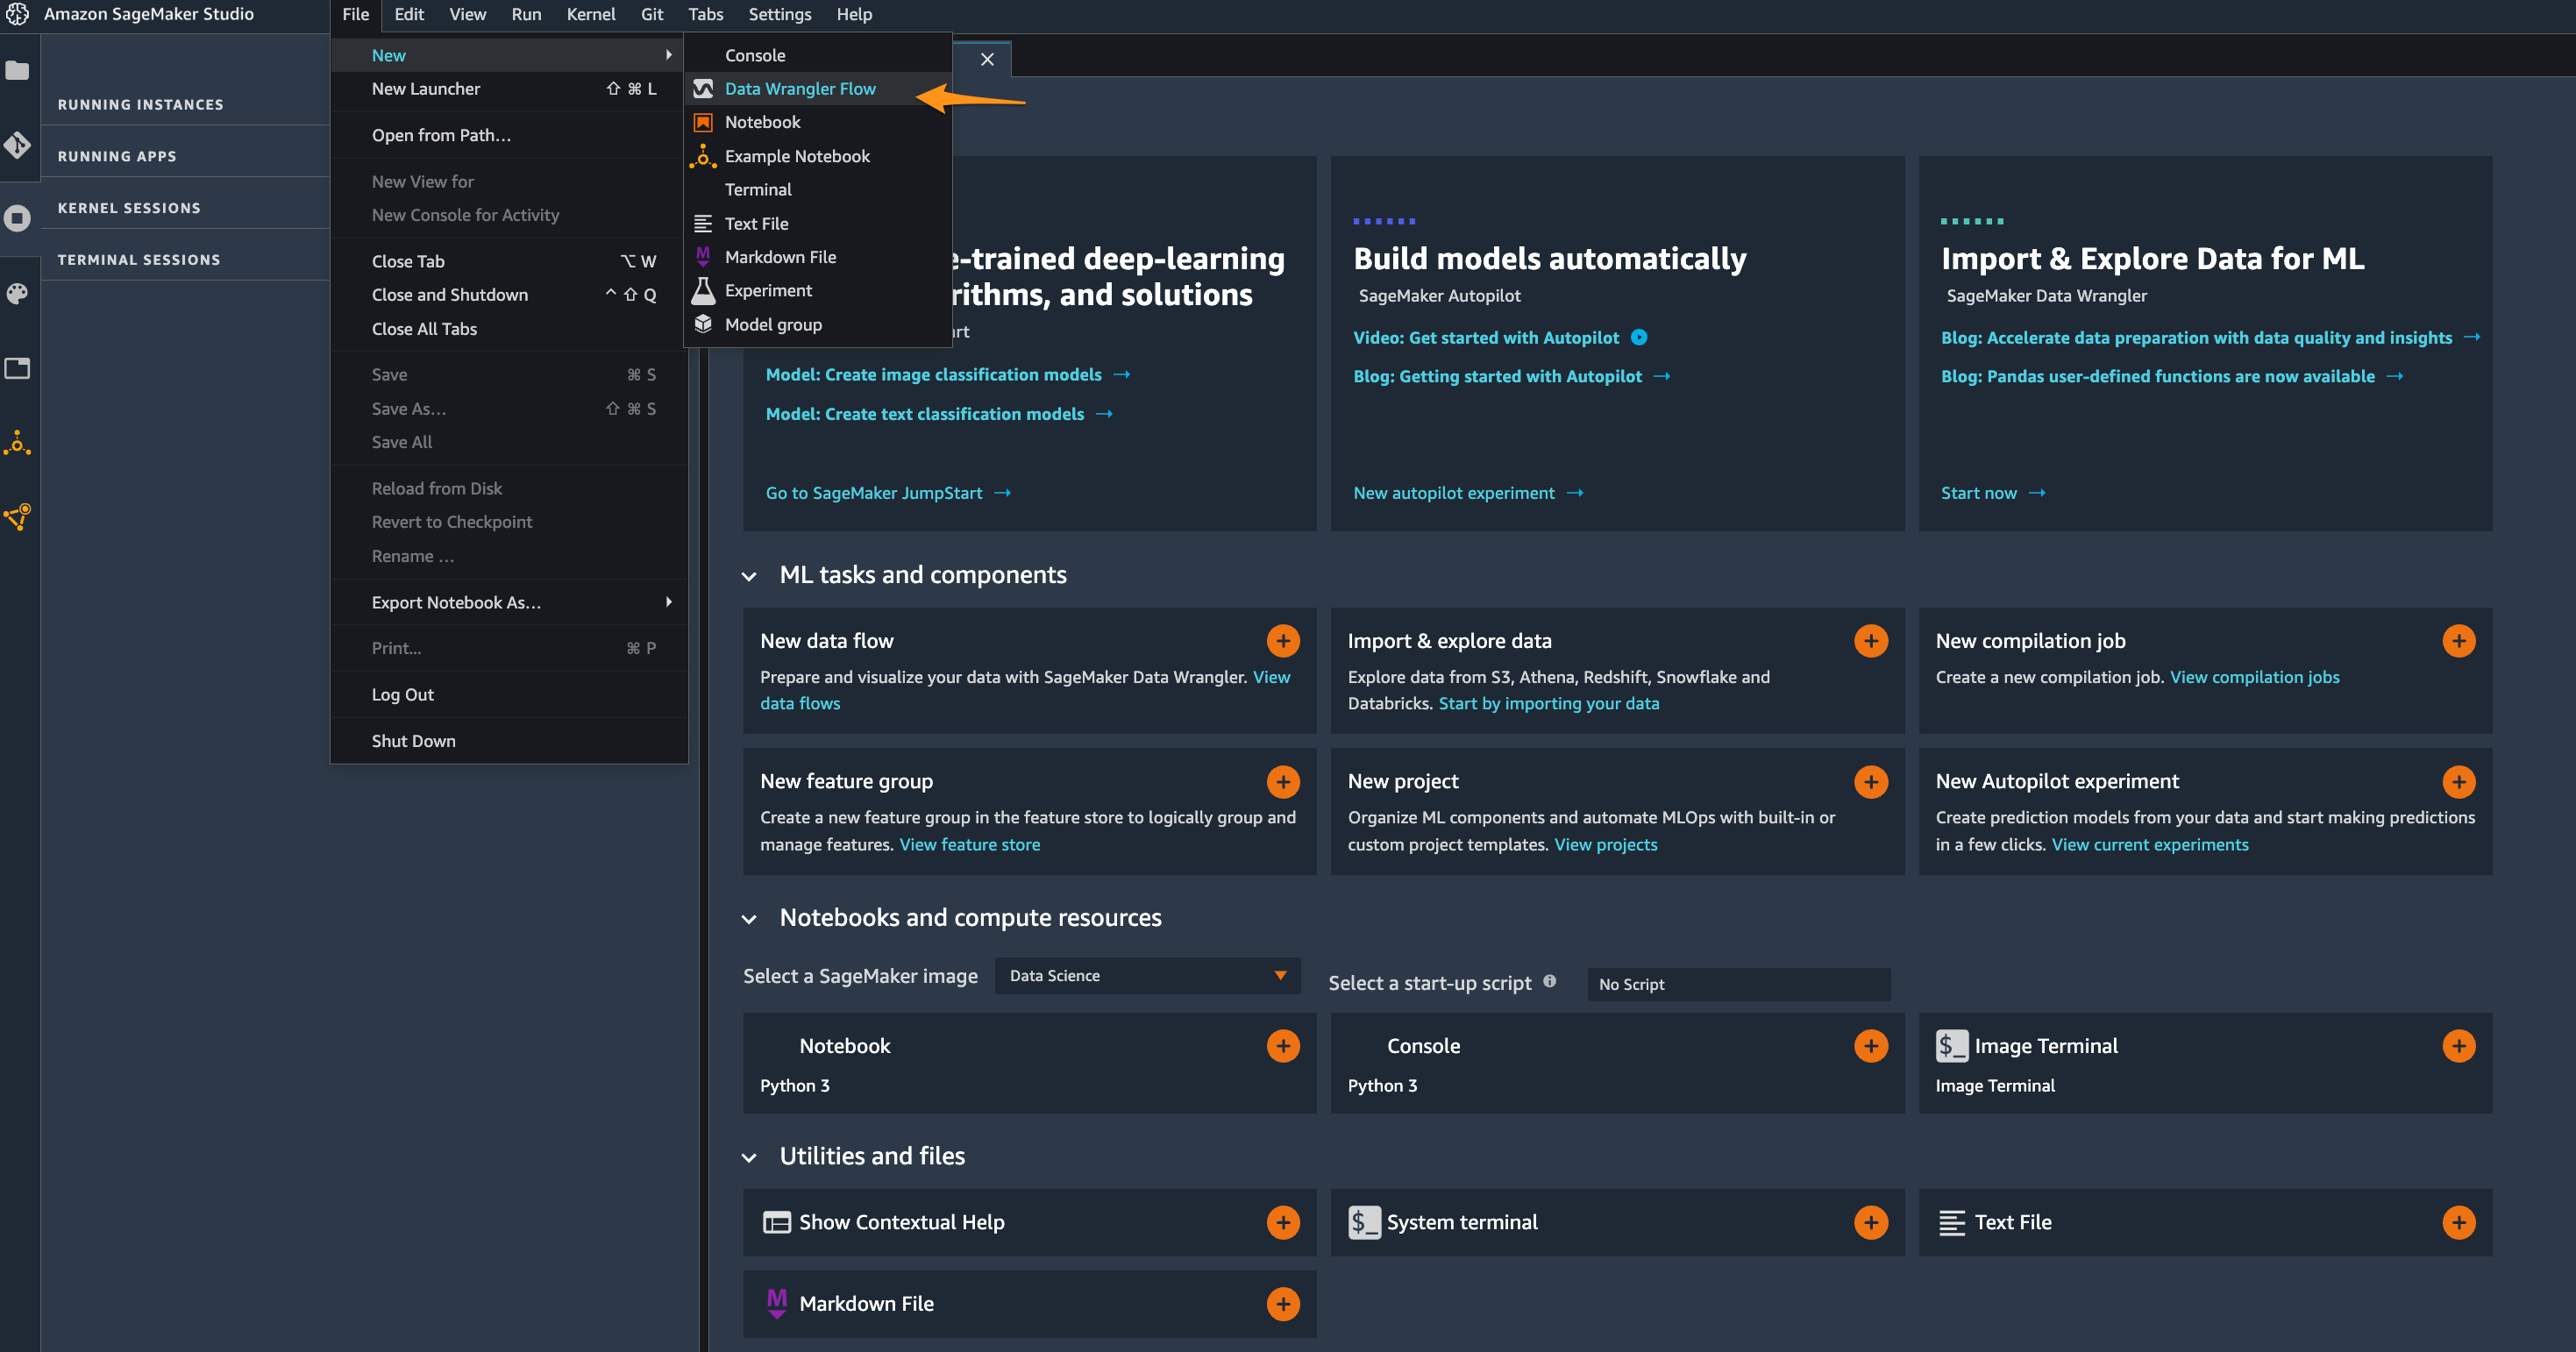
After you successfully log in to Studio, you should see a development environment like the following screenshot.
To create a new Data Wrangler workflow, on the File menu, choose New, then choose Data Wrangler Flow.
The first step in Data Wrangler is to import your data. You can import data from multiple data sources, such as Amazon S3, Amazon Athena, Amazon Redshift, Snowflake, and Databricks. In this example, we use Amazon S3.If you just want to see how Data Wrangler works, you can always choose Use sample dataset.
Choose Import data.
Choose Amazon S3.
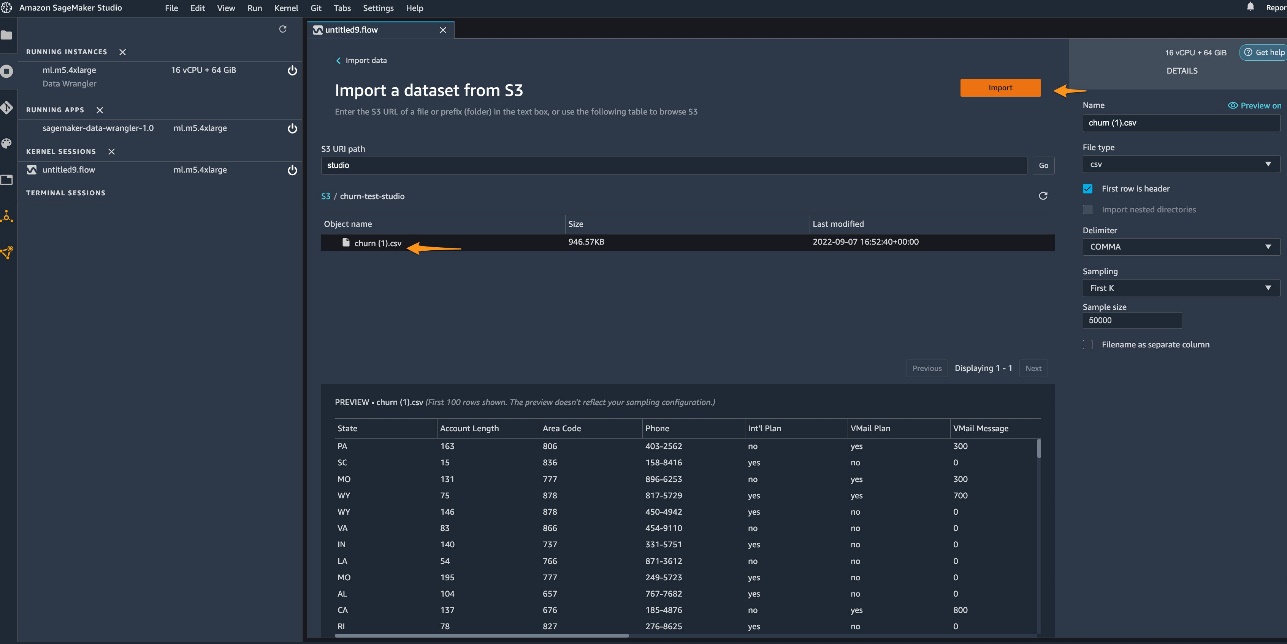
Choose the dataset you uploaded and choose Import.
Data Wrangler enables you to either import the entire dataset or sample a portion of it.
To quickly get insights on the dataset, choose First K for Sampling and enter 50000 for Sample size.
Understand data quality and get insights
Let’s use the Data Quality and Insights Report to perform an analysis of the data that we imported into Data Wrangler. You can use the report to understand what steps you need to take to clean and process your data. This report provides information such as the number of missing values and the number of outliers. If you have issues with your data, such as target leakage or imbalance, the insights report can bring those issues to your attention.
Choose the plus sign next to Data types and choose Get data insights.
For Analysis type, choose Data Quality and Insights Report.
For Target column, choose Churn?.
For Problem type¸ select Classification.
Choose Create.
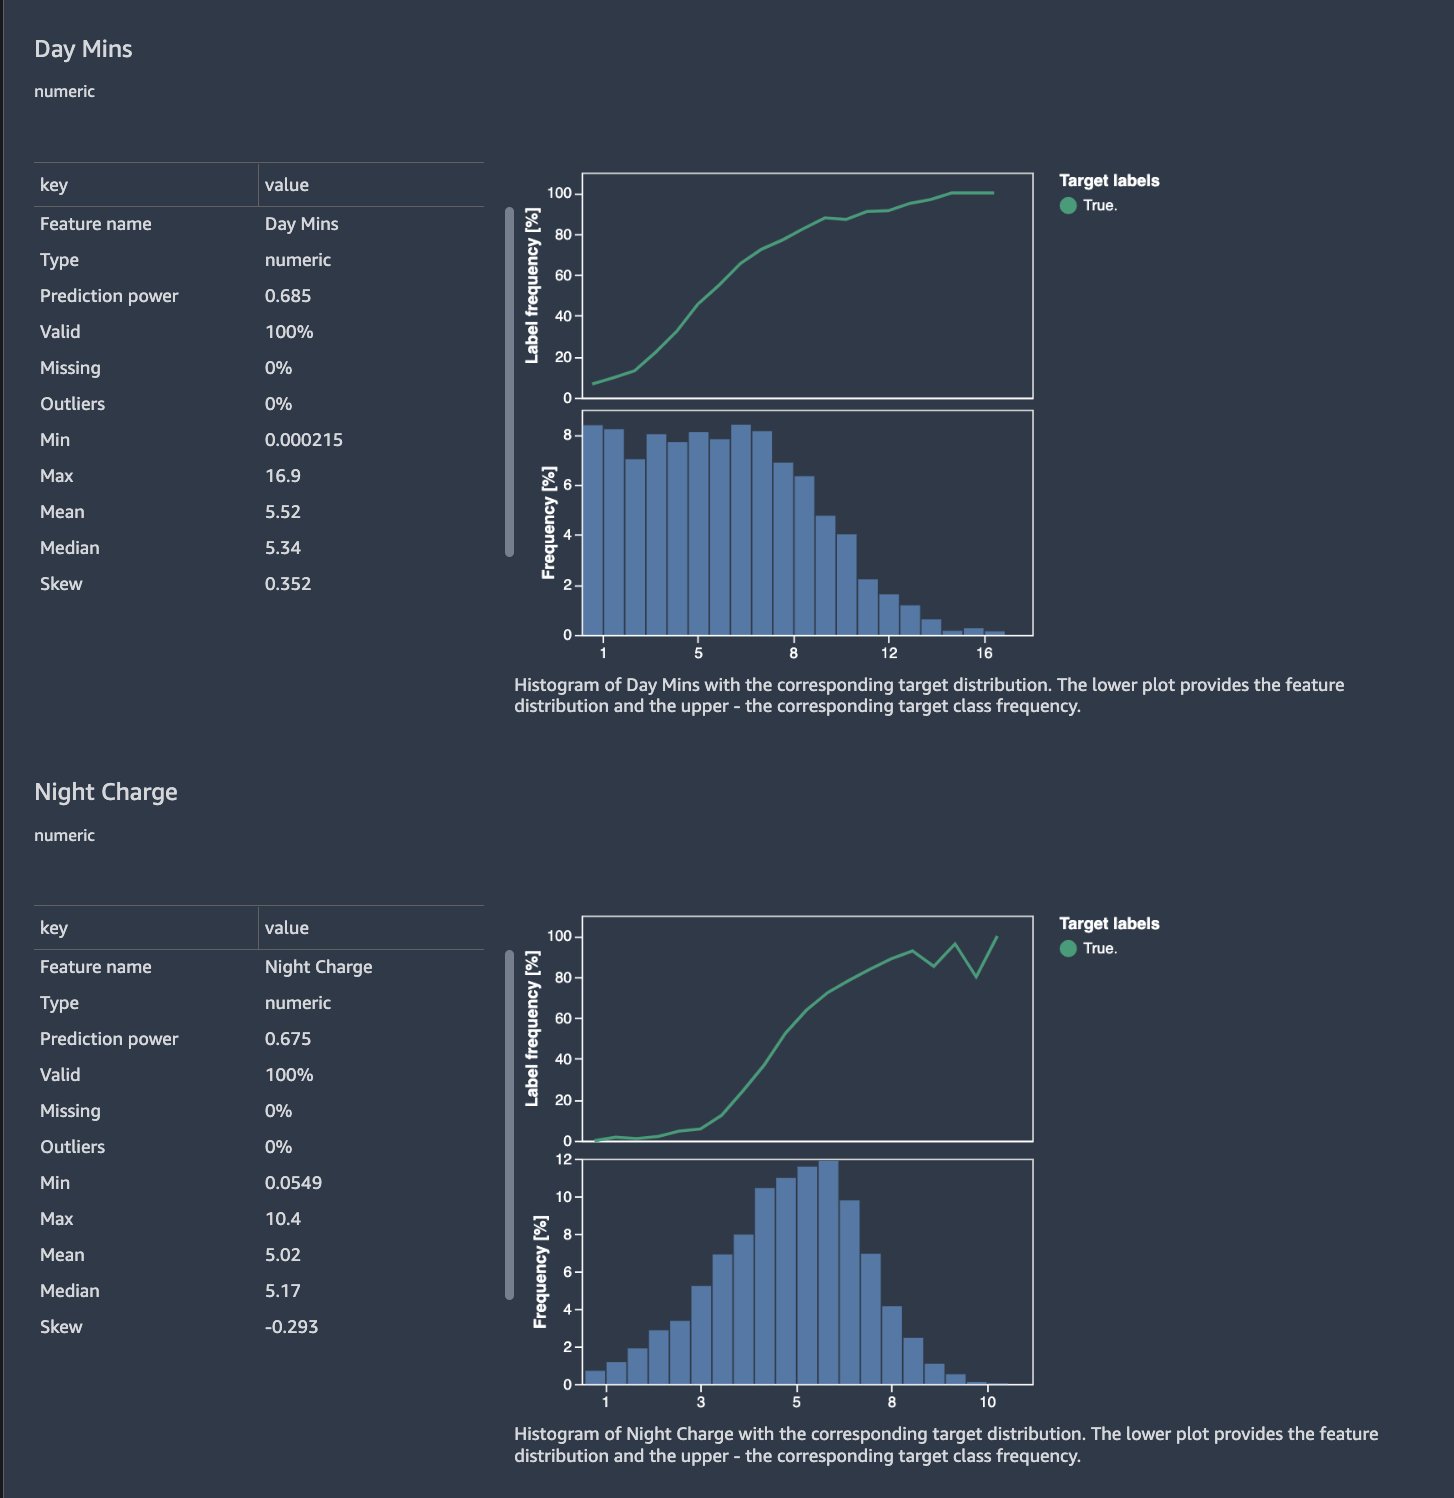
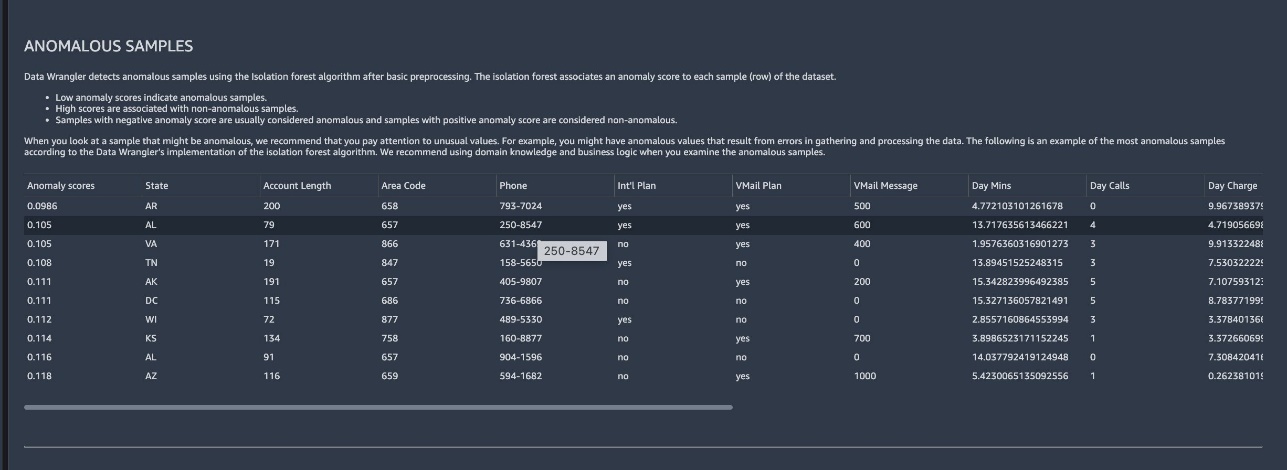
You’re presented with a detailed report that you can review and download. The report includes several sections such as quick model, feature summary, feature correlation, and data insights. The following screenshots provide examples of these sections.
Observations from the report
From the report, we can make the following observations:
No duplicate rows were found.
The State column appears to be quite evenly distributed, so the data is balanced in terms of state population.
The Phone column presents too many unique values to be of any practical use. Too many unique values make this column not useful. We can drop the Phone column in our transformation.
Based on feature correlation section of the report, Mins and Charge are highly correlated. We can remove one of them.
Transformation
Based on our observations, we want to make the following transformations:
Remove the Phone column because it has many unique values.
We also see several features that essentially have 100% correlation with one another. Including these feature pairs in some ML algorithms can create undesired problems, whereas in others it will only introduce minor redundancy and bias. Let’s remove one feature from each of the highly correlated pairs: Day Charge from the pair with Day Mins, Night Charge from the pair with Night Mins, and Intl Charge from the pair with Intl Mins.
Convert True or False in the Churn column to be a numerical value of 1 or 0.
Return to the data flow and choose the plus sign next to Data types.
Choose Add transform.
Choose Add step.
You can search for the transform you looking for (in our case, manage columns).
Choose Manage columns.
For Transform¸ choose Drop column.
For Columns to drop¸ choose Phone, Day Charge, Eve Charge, Night Charge, and Intl Charge.
Choose Preview, then choose Update.
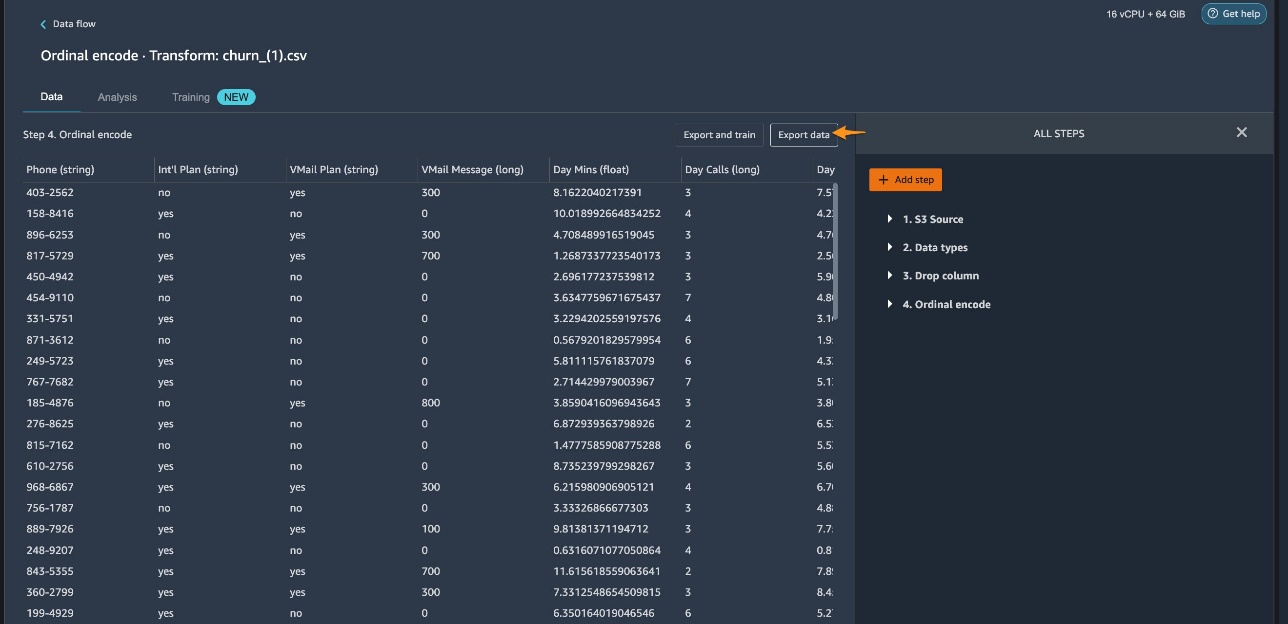
Let’s add another transform to perform a categorical encode on the Churn? column.
Choose the transform Encode categorical.
For Transform, choose Ordinal encode.
For Input columns, choose the Churn? column.
For Invalid handling strategy, choose Replace with NaN.
Choose Preview, then choose Update.
Now True and False are converted to 1 and 0, respectively.
Now that we have a good understand of the data and have prepared and transformed the data for model building, we can move the data to Studio Lab for model building.
Upload the data to Studio Lab
To start using the data in Studio Lab, complete the following steps:
Choose Export data to export to an S3 bucket.
For Amazon S3 location, enter your S3 path.
Specify the file type.
Choose Export data.
After you export the data, you can download the data from the S3 bucket to your local computer.
Now you can go to Studio Lab and upload the file to Studio Lab.
Alternatively, you can connect to Amazon S3 from Studio Lab. For more information, refer to Use external resources in Amazon SageMaker Studio Lab.
Let’s install SageMaker and import Pandas.
Import all libraries as required.
Now we can read the CSV file.
Let’s print churn to confirm the dataset is correct.
Now that you have the processed dataset in Studio Lab, you can carry out further steps required for model building.
Data Wrangler pricing
You can perform all the steps in this post for EDA or data preparation within Data Wrangler and pay for the simple instance, jobs, and storage pricing based on usage or consumption. No upfront or licensing fees are required.
Clean up
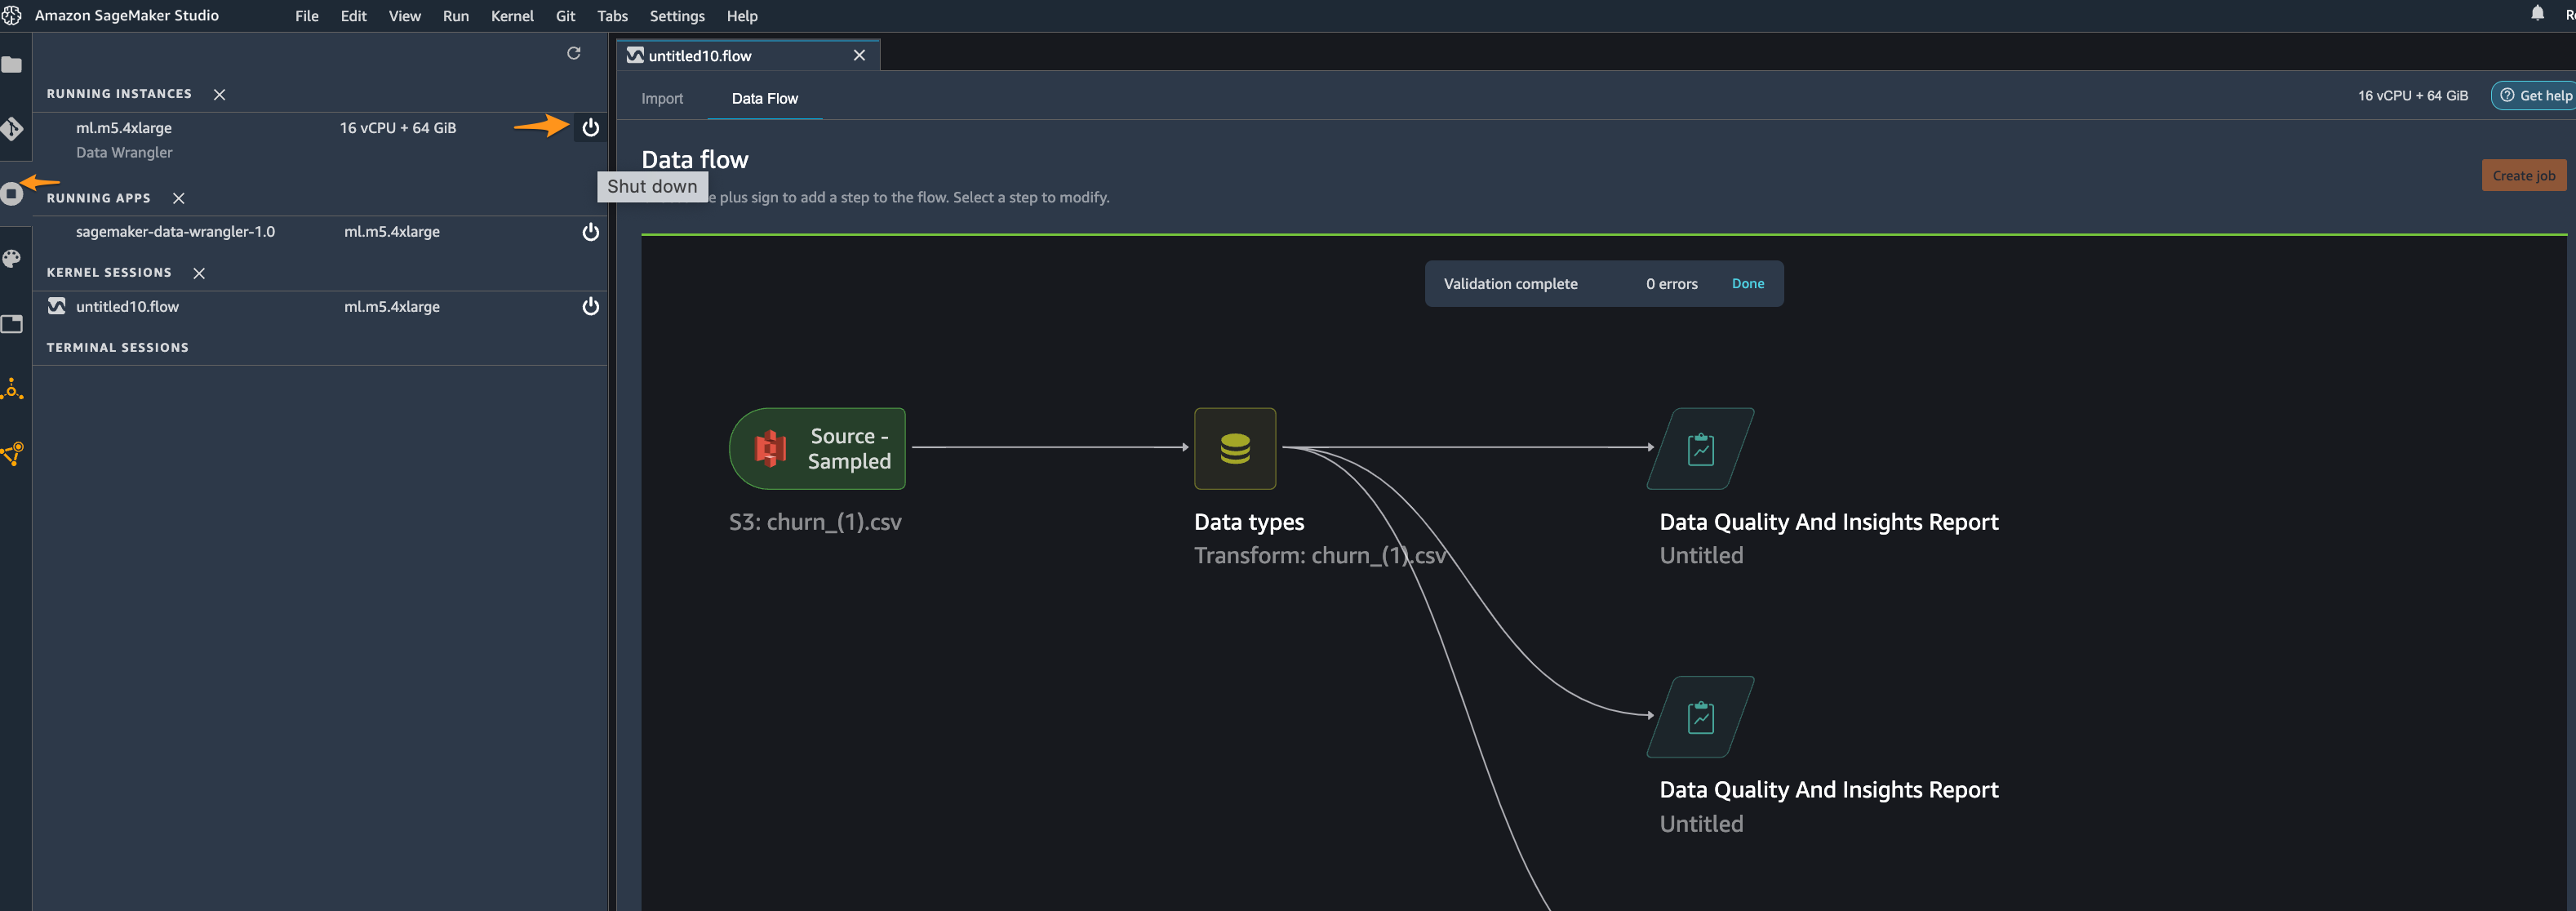
When you’re not using Data Wrangler, it’s important to shut down the instance on which it runs to avoid incurring additional fees. To avoid losing work, save your data flow before shutting Data Wrangler down.
To save your data flow in Studio, choose File, then choose Save Data Wrangler Flow.
Data Wrangler automatically saves your data flow every 60 seconds.
To shut down the Data Wrangler instance, in Studio, choose Running Instances and Kernels.
Under RUNNING APPS, choose the shutdown icon next to the sagemaker-data-wrangler-1.0 app.
Choose Shut down all to confirm.
Data Wrangler runs on an ml.m5.4xlarge instance. This instance disappears from RUNNING INSTANCES when you shut down the Data Wrangler app.
After you shut down the Data Wrangler app, it has to restart the next time you open a Data Wrangler flow file. This can take a few minutes.
Conclusion
In this post, we saw how you can gain insights into your dataset, perform exploratory data analysis, prepare and transform data using Data Wrangler within Studio, and export the transformed and prepared data to Studio Lab and carry out model building and other steps.
With SageMaker Data Wrangler, you can simplify the process of data preparation and feature engineering, and complete each step of the data preparation workflow, including data selection, cleansing, exploration, and visualization from a single visual interface.
About the authors
Rajakumar Sampathkumar is a Principal Technical Account Manager at AWS, providing customers guidance on business-technology alignment and supporting the reinvention of their cloud operation models and processes. He is passionate about the cloud and machine learning. Raj is also a machine learning specialist and works with AWS customers to design, deploy, and manage their AWS workloads and architectures.
Meenakshisundaram Thandavarayan is a Senior AI/ML specialist with a passion to design, create and promote human-centered Data and Analytics experiences. He supports AWS Strategic customers on their transformation towards data driven organization.
James Wu is a Senior AI/ML Specialist Solution Architect at AWS. helping customers design and build AI/ML solutions. James’s work covers a wide range of ML use cases, with a primary interest in computer vision, deep learning, and scaling ML across the enterprise. Prior to joining AWS, James was an architect, developer, and technology leader for over 10 years, including 6 years in engineering and 4 years in marketing & advertising industries.
Read MoreAWS Machine Learning Blog