Editor’s Note:This post is part of our Google I/O 2023 series sharing the latest Google Maps Platform news from our annual developer conference. To learn more about our maps customization products, join our I/O session when it premieres at 1 p.m. PT.
One of the top requests we get from our community is for more advanced marker and styling capabilities. Today we’re launching the Preview release of data-driven styling for geospatial datasets, for the Maps JavaScript API. Now you can import, store, and manage your geospatial data server-side in the Google Cloud console. You can also visualize and style your geospatial data as points, lines, and polygons on a map. We’re also making data-driven styling for boundaries and advanced markers, the latest cloud-based maps styling features, generally available for the Maps JavaScript API.
Import, visualize, and style your geospatial data with data-driven styling for datasets
To date, you’ve had to manage and store large datasets client-side to visualize your geospatial data. This led to higher infrastructure costs and the need to pre-process the data before displaying it. Adding geospatial datasets via custom overlays also results in slower map performance, and lag in loading of data as the user pans and zooms across the map.
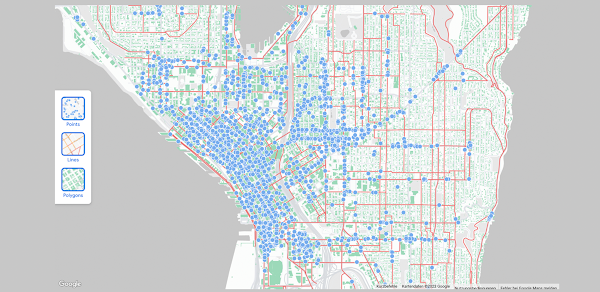
With data-driven styling for datasets, you can now easily style and visualize your geospatial data in GeoJSON, CSV, and KML formats as points, lines, and polygons on a map. This makes it easier to create interactive and insightful visual experiences that provide more context for your users. You can use the new Maps Datasets API to import, store, and manage your geospatial data server-side via the Google Cloud console to help lower infrastructure costs, manage data access, and update your geospatial data anytime, anywhere. To learn more about data-driven styling for datasets, visit our documentation or our demo.
Trees in Seattle, styled as points on a map
Visualize insights with less effort
Data-driven styling for boundaries gives you the ability to build maps with the same boundaries and polygons used in Google Maps. Since the Preview launch of data-driven styling for boundaries, you’ve used it to enable a wide range of use cases across industries, including real estate, travel, government, healthcare, education, and more. To learn more about data-driven styling for boundaries, visit our documentation or demo.
Realtors Property Resource (RPR), a U.S.-based data platform built for real estate agents, uses data-driven styling to help agents easily visualize market trends on a map, so they can better serve homebuyers.
Easily create customized markers
With advanced markers you can easily create customized, more performant markers. Since we launched in Preview, we’ve seen customers across industries use advanced markers to create customized experiences showcasing their brand, displaying crucial logistics information, and more. To learn more about advanced markers, check out the documentation and demo.
Rocket Entertainment
Rocket Entertainment used advanced markers and the new Aerial View API to create an immersive L.A. map experience celebrating Elton John’s final North American tour.
Elton John’s L.A. map experience using advanced markers
Fr8app
Fr8app, a cloud-based marketplace that simplifies international over-the-road shipping, uses advanced markers to display important information about their trucking partners.
Get started with data-driven styling and advanced markers
Data-driven styling and advanced markers are the latest cloud-based maps styling features included with Dynamic Maps for the Maps JavaScript API. To learn more about how to create customized map visualization experiences using these new capabilities, watch our I/O session.
Stay tuned for the extension of advanced markers and data-driven styling into native Android and iOS apps to address on-the-go use cases. Our team is eager to see what new possibilities these features open up for styling your maps.
Cloud BlogRead More


