

Many organizations these days have a mandate to comply with database regulatory and compliance requirements. Storing and using relevant metadata for these requirements has become extremely important.
This is the second of a two-part post. In Part 1, we discussed two approaches to audit Amazon Aurora PostgreSQL-Compatible Edition databases: the Database Activity Streams feature and pgAudit extension. In this post, we discuss two use cases and the detailed steps to implement an auditing solution with each method:
Use case 1 – Auditing activities using Database Activity Streams on Aurora PostgreSQL and then notifying stakeholders in near-real time by integrating with AWS native services such as AWS Lambda, Amazon Simple Notification Service (Amazon SNS), and Amazon CloudWatch.
Use case 2 – Auditing the database for a particular database user using pgAudit. We discuss different levels of auditing and how to configure an alerting mechanism to notify stakeholders in near-real time of any suspicious activity. You can also use this strategy with Amazon Relational Database (Amazon RDS) for PostgreSQL.
Use case 1: Audit with Database Activity Streams
To implement this database auditing solution using Database Activity Streams, we need to complete the following steps:
Enable the Database Activity Streams feature on our Aurora PostgreSQL cluster
Create an Amazon Simple Storage Service (Amazon S3) bucket to store the stream logs
Configure an Amazon Kinesis Data Firehose delivery stream
Create the first AWS Lambda function to decrypt the streams
Deploy an AWS CloudFormation template to create the SNS topic and a second Lambda function to trigger alerts
Configure the second Lambda function and add a trigger on the first function’s CloudWatch log group
Subscribe to the SNS topic
Add a trigger for the second function with the log group of the first function and add a filter pattern in the trigger parameters
Test the solution by simulating database changes to capture the activities in the activity stream
The following diagram illustrates our solution architecture:
The following diagram illustrates the report generation workflow, which is an optional step:
Prerequisites
Configure Network Address Translation (NAT) in your VPC along with AWS Key Management Service (AWS KMS) endpoint for use with Database Activity Streams. Follow the instructions on the Prerequisites as the requirements are the same for Aurora PostgreSQL and MySQL. In addition, you can grant appropriate AWS Identity and Access Management (IAM) role privileges to a user to carry out basic operational activities, such as starting and stopping the cluster stream. As a best practice, we suggest not granting these privileges to the DBA.
You must also install Python3 in your machine so you can install dependencies for the AWS Lambda function.
Be mindful before enabling activity streams on the Aurora cluster as, it restarts all the instances (primary and replicas) within that cluster. Therefore, we recommend performing this activity during a business downtime or maintenance window.
Enable the Database Activity Streams feature on Aurora PostgreSQL cluster
To start using Database Activity Streams for auditing, complete the following steps:
On the Amazon RDS console, select your active RDS cluster
On the Actions menu, choose Start database activity stream
Select Apply immediately
Choose Continue
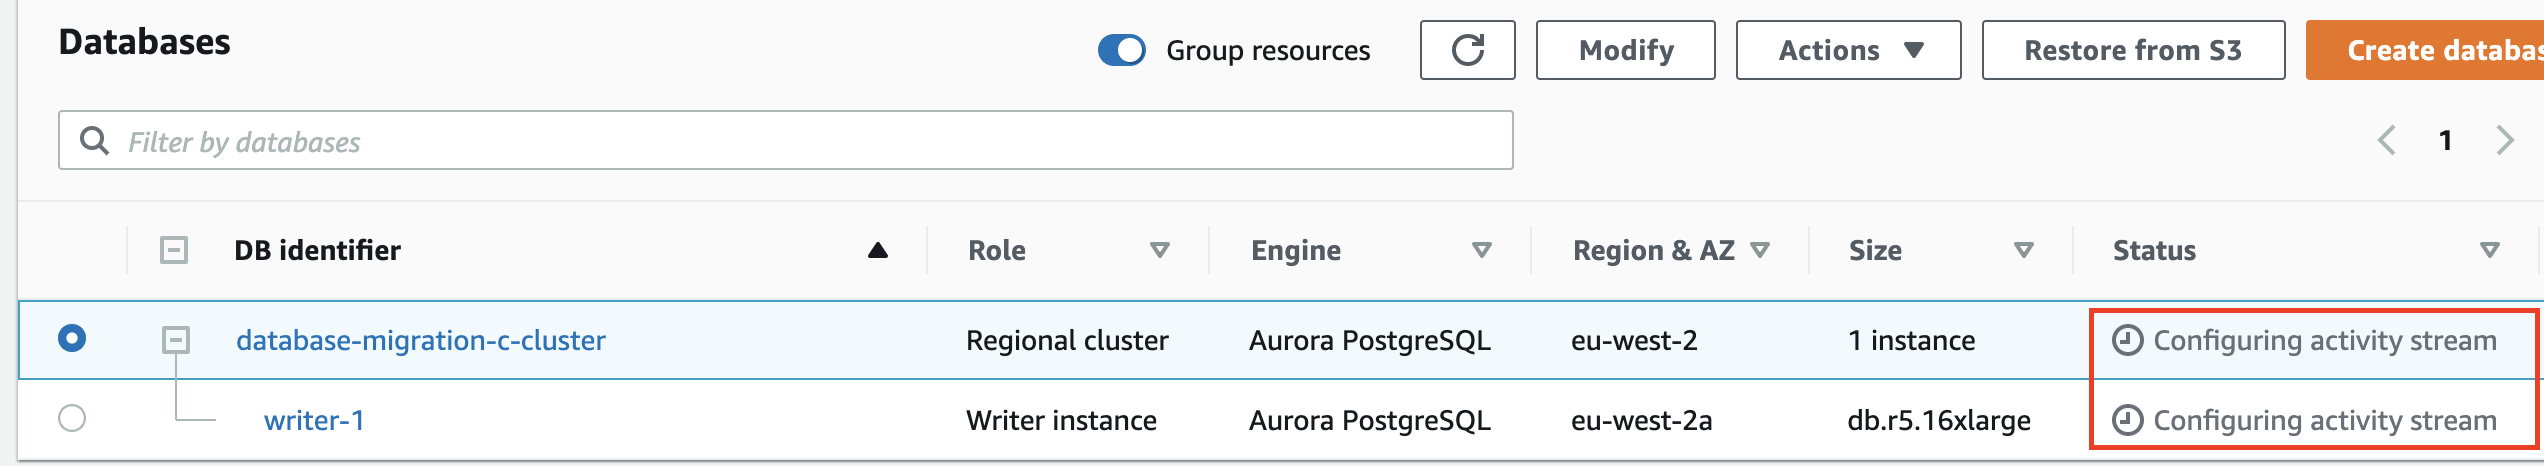
Monitor the status of the configuration on the Databases page.
Create an S3 bucket
You can create an S3 bucket to store the stream logs using the Amazon S3 console, AWS SDKs, or the AWS Command Line Interface (AWS CLI). For instructions, visit Creating a bucket.
For archiving and long-term record storage, you can configure Amazon S3 Lifecycle.
Configure Kinesis Data Firehose delivery stream
After you activate the database activity stream, you must create your Firehose delivery stream.
On the Kinesis console, choose Data Firehose in the navigation pane
Choose Create delivery stream
For Source, choose Amazon Kinesis Data Streams
For Destination, choose Amazon S3
For Delivery stream name, enter a name for your delivery stream
This configuration streams the records to a target S3 bucket. We can also convert the records to ORC or Parquet format to improve query performance on Amazon Athena (if you’re using Athena to query the data).
Create a Lambda function to decrypt the streams
We create our first Lambda function (as shown in the next screenshot) to decrypt the streams and push the records to Amazon S3 via Kinesis Data Firehose.
Before creating the function, ensure there is an IAM role with READ permissions on Kinesis Firehose. In case there isn’t one already, you must create a new role which will be referred in the next step while creating function.
The function gets automatically triggered when the stream is activated and data arrives in the Kinesis shards. The records are decrypted and eventually pushed to the target S3 bucket.
Here, you need to create the function with an IAM role that has read permissions for Kinesis Data Firehose.
After you create the function, download the lambda1.zip file. Unzip this in a directory lambda_das and run the following command to install the function dependencies:
This will download all the required packages for you in the lambda_das directory. Now, compress this directory to lambda1.zip as:
Now, upload this lambda1.zip in lambda console as shown in the following screenshot:
Add a Kinesis trigger to the function with “+ Add trigger” and choose “Kinesis” in the dropdown for Trigger Configuration. Select Kinesis stream name and add the trigger. Once trigger is created, go to the Configuration tab and select “Environment variables”.
Environment variables are used to customize function behavior across different environments without updating the code. i.e. If same code needs to be executed across test and production environments. Two functions can be created with same code, but with different configurations using the environment variables.
Create the following environment variables for the Lambda function :
Cluster_id : Aurora PostgreSQL Resource id [RDS->Databases->AuroraDB->Configuration]
Firehose_stream: Delivery stream name
Key_id: AWS KMS Key ID
Region_name: Region in which Aurora PostgreSQL instance is created
Stream_name: Kinesis data stream name
The following screenshot shows the environment variables for first Lambda function:
Kinesis Data Firehose captures decrypted records from this function, optionally converts them to ORC or Parquet, and then buffers for a specified time or size before pushing them to the target S3 bucket.
When you create this function, it creates a CloudWatch log group where you can review decrypted log records.
Create an SNS topic and second Lambda function with AWS CloudFormation
The provided CloudFormation template creates your second Lambda function, which is triggered based on a matching pattern from the first function’s log group. The template also creates an SNS topic that sends notifications based on the alerts generated in the previous step.
Deploy the CloudFormation template
Next, we deploy the CloudFormation template to create the resources.
Download the CloudFormation template
Download the Lambda function code from GitHub and upload it to an S3 Bucket.
In the CloudFormation console, choose Create stack With new resources (standard)
In Specify template choose Upload a template file and upload the template.
Choose Next
Enter a Stack name and fill out the Parameters section
Prefix: All alert notifications will be sent using this prefix so recipients can easily identify them
RecipientEmail: The email address that will receive the alert notifications
s3Bucket: The name of the S3 Bucket used in Step 2.
s3Key: This value should be filled out by default (lambda_DASAlert_function.zip), if you changed the Lambda function zip package name, make sure you update this parameter as well.
Choose Next
Choose Next
Check the I acknowledge that AWS CloudFormation might create IAM resources with custom names box and choose Create stack
Stack creation should take approximately 5 minutes. After we create the stack, an email is triggered to the emailID provided in the CloudFormation parameter. Subscribe to the email which will allow Amazon SNS to send future email alerts received by the topic. For more details about Amazon SNS subscription read Getting started with Amazon SNS.
Open the recently created Lambda function and add a trigger using the log group of the first function, as shown in the following screenshot:
Use the following code for the filter pattern:
Be cautious while adding the filter conditions! If the filter pattern is very generic or very frequently appearing in the database SQLs, that may send thousands of email notifications to your inbox. You can learn more in Lambda event filtering.
For example, If a user adds a filter pattern like:
Then, every database SQL statement on the database cluster with the word SELECT in it, will trigger an email notification.
The following screenshot shows the filter pattern configured as a trigger on the Lambda function:
By default, the retention period for the log group is set to never expire. This retains all the log records forever. Configure the retention period as per your requirements.
Test the solution
To test the solution, we run sample queries on the Aurora PostgreSQL database.
Connect to Amazon Aurora PostgreSQL database using command line access (psql) or GUI (pgAdmin).
The following screenshot shows the code of the log group:
For more information about the audited fields in the activity stream, visit Monitoring Amazon Aurora using Database Activity Streams.
The following screenshot shows our email notification sent via Amazon SNS:
Considerations and limitations
When choosing to audit using Database Activity Streams, consider the performance impact and cost. We have discussed this earlier in Part 1 of this series as well.
Use case 2: Audit using pgAudit
You can use pgAudit for auditing the database using different use cases. To implement our auditing solution using pgAudit, you must complete the following steps:
Enable the pgAudit parameter in the cluster parameter group.
Create the pgAudit extension.
Deploy a CloudFormation stack to create a Lambda function to grep the pattern and send notification.
Enable auditing at the database user level.
Test the solution by granting and revoking user permissions.
The following diagram illustrates our solution architecture:
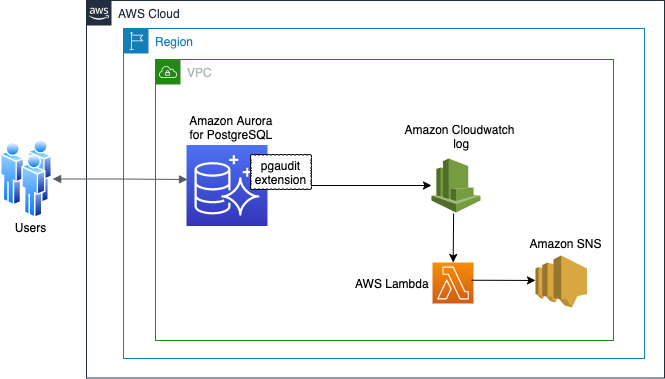
You can find the pgAudit parameter settings in both the cluster and DB parameters (following screenshot) and set requirements as needed. For example, to enable the pgAudit log setting on the instance level but not on the cluster, set the instance-level (DB parameter) parameter group.
Enable pgAudit
To enable pgAudit, complete the following steps:
Set shared_preload_libararies=pgAudit in the cluster or DB parameter group. A restart is required to put the changes into effect. For more details on how to modify parameter groups, refer to Modifying parameters in a DB parameter group.
As we need a separate role for auditing, create a role rds_pgaudit in the database and set the pgAudit.role parameter in the cluster or DB parameter group. Create the same role that is mentioned in the allowed values (for example, rds_pgAudit).
Connect to database using psql or any client tool and create the role rds_pgAudit as shown in the following screenshot.
The following screenshot shows the updated parameter group.
Create the pgAudit extension
The next step is to create the extension in your database. Connect to the database and run the following command:
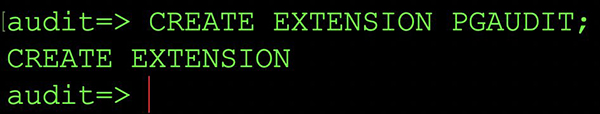
Deploy a CloudFormation stack to create a Lambda function
Before deploying the CloudFormation template you must publish the database logs to Amazon Cloudwatch.
In next step the provided CloudFormation template creates an AWS Lambda function to capture patterns from the CloudWatch Aurora PostgreSQL log group. If it finds a matching pattern, it triggers a notification using Amazon SNS.
Launch the CloudFormation template.
For Stack name, enter a name.
For FilterPattern, enter the pattern for the function to capture.
For LogGroup, enter the log group.
For PrefixName, enter a prefix that is added to every resource the stack provisions.
For SNSTopicARN, enter the ARN of the SNS topic.
Choose Next and complete your stack creation.
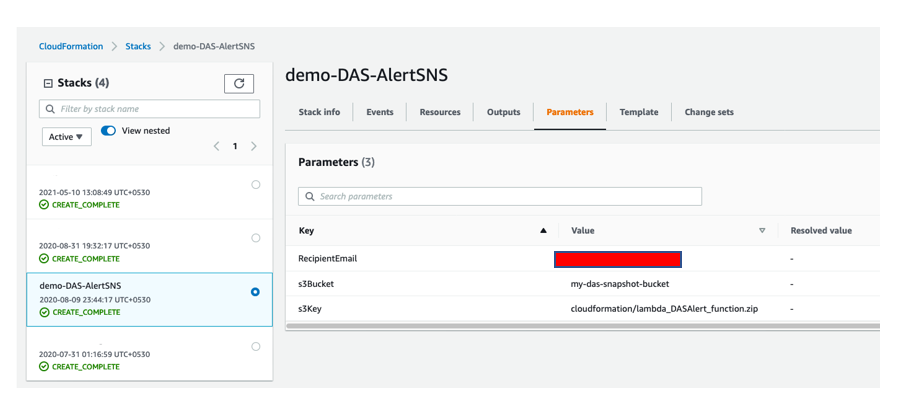
The following screenshot shows the resources the stack creates:
Enable auditing at the user level
In this use case, we demonstrate auditing an application user who logs in to the database to perform regular activities. We want to audit if the user runs any statements related to roles and privileges, such as GRANT, REVOKE, ALTER ROLE, CREATE ROLE, or DROP ROLE.
After we create the extension in the database, we’re ready to enable auditing at a user level.
Connect to the database using psql or any client tool using database user:
You can use the pg_settings table to check the settings on the database.
Enable auditing for app_user (for this use case, we want to audit GRANT, REVOKE, and ALTER commands this user runs).
You specify which classes of statements are logged by session audit logging. Possible values include the following:
READ – SELECT and COPY when the source is a relation or a query
WRITE – INSERT, UPDATE, DELETE, TRUNCATE, and COPY when the destination is a relation
FUNCTION – Function calls and DO blocks
ROLE – Statements related to roles and privileges: GRANT, REVOKE, CREATE/ALTER/DROP ROLE
DDL – All DDL that is not included in the ROLE class
MISC – Miscellaneous commands, such as DISCARD, FETCH, CHECKPOINT, VACUUM, and SET
MISC_SET – Miscellaneous SET commands, for example SET ROLE
ALL – Include all of the above
Test the solution
To test the solution, connect to the database with app_user and check if the settings are correct, as shown in the following screenshot:
You can add the new user app_user_new and try to access tables whose owner is app_user.
Now let’s connect to the database using object owner and GRANT SELECT, INSERT permissions to app_user_new and check the log file to determine whether these statements are logged.
The following screenshot shows the output of the CloudWatch log, which shows GRANT captured in the log file.
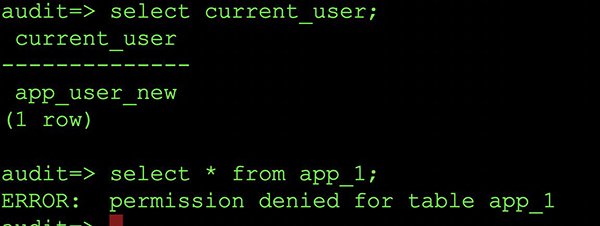
Now, let’s revoke SELECT permissions on the table (app_1) from app_user_new.
The following screenshot shows the CloudWatch log file.
If you want to know more about everything captured in the log file, you can use the parameter log_line_prefix, which is static and can’t be modified by users:
Understanding the log_line_prefix makes it easier to read the log file. Basically, all auditing is logged into the log file.
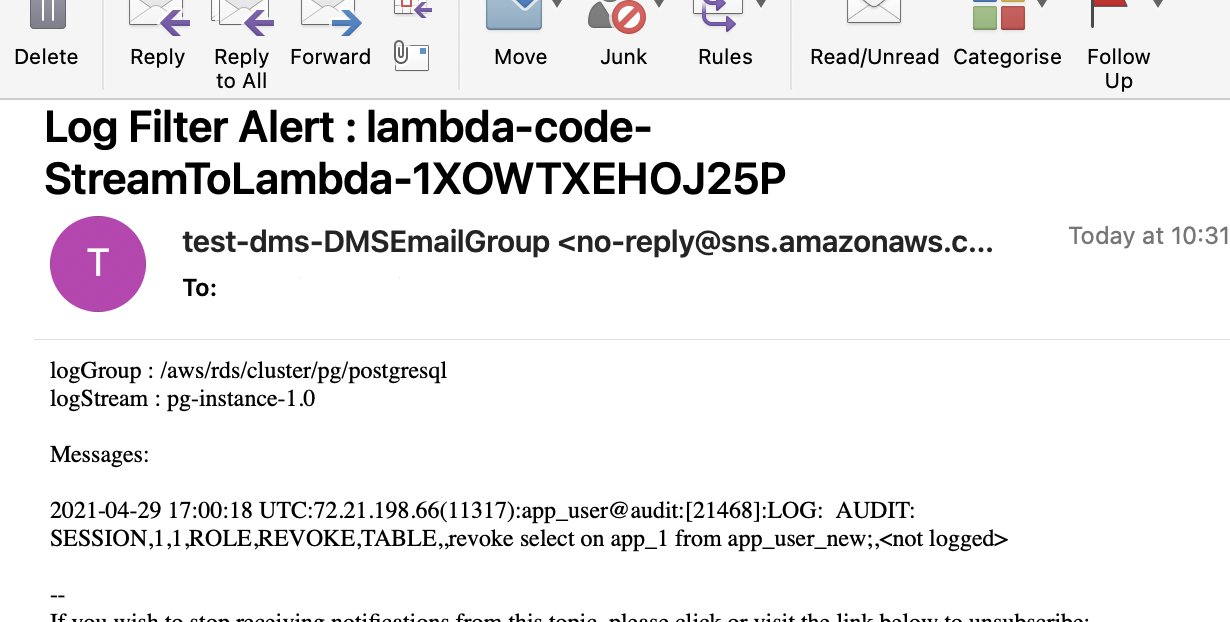
To get an email notification, we use Amazon SNS and Lambda. The Lambda function puts the hook on the CloudWatch group and when the given pattern matches, it captures and sends the log information via email.
The following screenshot shows our email notification:
Considerations and limitations
When choosing pgAudit, consider the performance impact and cost. Enabling pgAudit extension doesn’t incur any additional costs. However, overall cost for the solution depends upon Amazon CloudWatch, AWS Lambda invocations and Amazon SNS.
Conclusion
In this post, we showed how you can use two different auditing solutions to capture auditing information required for compliance. The decision to use either method depends on your use case, cost, and performance impact. We suggest doing thorough performance testing after enabling auditing in a lower environment to check the CPU and memory footprint and make an informed decision accordingly prior to production implementation.
If you have any comments or questions about this post, please share them in the comments.
About the Author
HariKrishna Boorgadda is a Senior Consultant with the Professional Services teamat Amazon Web Services. He focuses on database migrations to AWS and works with customers to design and implement Amazon RDS and Aurora architectures.
Swanand Kshirsagar is a Lead Consultant with Professional Services team at Amazon Web Services. He works with customers to build scalable, highly available and secure solutions in AWS cloud. His focus area is homogenous and heterogeneous migrations of on-premise databases to AWS RDS and Aurora PostgreSQL.
Rajesh Madiwale is a Lead Consultant with Amazon Web Services. He has deep expertise on database development and administration on Amazon RDS for PostgreSQL, Aurora PostgreSQL, Redshift, MySQL and Greenplum databases. He is an ardent member of the PostgreSQL community and has been working on PostgreSQL his entire tenure. He has also delivered several sessions at PostgreSQL conferences.
Read MoreAWS Database Blog