

This post is co-written by Goktug Cinar, Michael Binder, and Adrian Horvath from Bosch Center for Artificial Intelligence (BCAI).
Revenue forecasting is a challenging yet crucial task for strategic business decisions and fiscal planning in most organizations. Often, revenue forecasting is manually performed by financial analysts and is both time consuming and subjective. Such manual efforts are especially challenging for large-scale, multinational business organizations that require revenue forecasts across a wide range of product groups and geographical areas at multiple levels of granularity. This requires not only accuracy but also hierarchical coherence of the forecasts.
Bosch is a multinational corporation with entities operating in multiple sectors, including automotive, industrial solutions, and consumer goods. Given the impact of accurate and coherent revenue forecasting on healthy business operations, the Bosch Center for Artificial Intelligence (BCAI) has been heavily investing in the use of machine learning (ML) to improve the efficiency and accuracy of financial planning processes. The goal is to alleviate the manual processes by providing reasonable baseline revenue forecasts via ML, with only occasional adjustments needed by the financial analysts using their industry and domain knowledge.
To achieve this goal, BCAI has developed an internal forecasting framework capable of providing large-scale hierarchical forecasts via customized ensembles of a wide range of base models. A meta-learner selects the best-performing models based on features extracted from each time series. The forecasts from the selected models are then averaged to obtain the aggregated forecast. The architectural design is modularized and extensible through the implementation of a REST-style interface, which allows continuous performance improvement via the inclusion of additional models.
BCAI partnered with the Amazon ML Solutions Lab (MLSL) to incorporate the latest advances in deep neural network (DNN)-based models for revenue forecasting. Recent advances in neural forecasters have demonstrated state-of-the-art performance for many practical forecasting problems. Compared to traditional forecasting models, many neural forecasters can incorporate additional covariates or metadata of the time series. We include CNN-QR and DeepAR+, two off-the-shelf models in Amazon Forecast, as well as a custom Transformer model trained using Amazon SageMaker. The three models cover a representative set of the encoder backbones often used in neural forecasters: convolutional neural network (CNN), sequential recurrent neural network (RNN), and transformer-based encoders.
One of the key challenges faced by the BCAI-MLSL partnership was to provide robust and reasonable forecasts under the impact of COVID-19, an unprecedented global event causing great volatility on global corporate financial results. Because neural forecasters are trained on historical data, the forecasts generated based on out-of-distribution data from the more volatile periods could be inaccurate and unreliable. Therefore, we proposed the addition of a masked attention mechanism in the Transformer architecture to address this issue.
The neural forecasters can be bundled as a single ensemble model, or incorporated individually into Bosch’s model universe, and accessed easily via REST API endpoints. We propose an approach to ensemble the neural forecasters through backtest results, which provides competitive and robust performance over time. Additionally, we investigated and evaluated a number of classical hierarchical reconciliation techniques to ensure that forecasts aggregate coherently across product groups, geographies, and business organizations.
In this post, we demonstrate the following:
How to apply Forecast and SageMaker custom model training for hierarchical, large-scale time-series forecasting problems
How to ensemble custom models with off-the-shelf models from Forecast
How to reduce the impact of disruptive events such as COVID-19 on forecasting problems
How to build an end-to-end forecasting workflow on AWS
Challenges
We addressed two challenges: creating hierarchical, large-scale revenue forecasting, and the impact of the COVID-19 pandemic on long-term forecasting.
Hierarchical, large-scale revenue forecasting
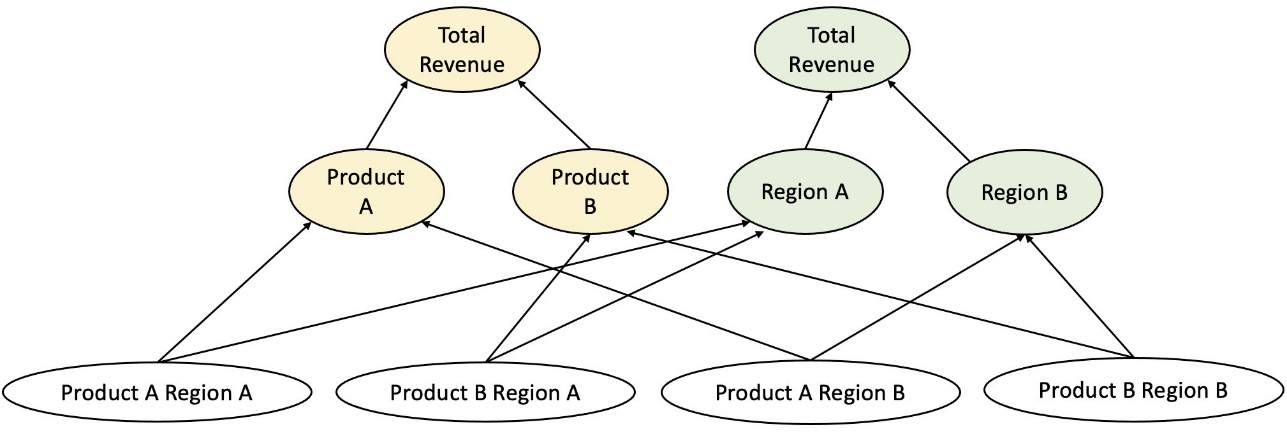
Financial analysts are tasked with forecasting key financial figures, including revenue, operational costs, and R&D expenditures. These metrics provide business planning insights at different levels of aggregation and enable data-driven decision-making. Any automated forecasting solution needs to provide forecasts at any arbitrary level of business-line aggregation. At Bosch, the aggregations can be imagined as grouped time series as a more general form of hierarchical structure. The following figure shows a simplified example with a two-level structure, which mimics the hierarchical revenue forecasting structure at Bosch. The total revenue is split into multiple levels of aggregations based on product and region.
The total number of time series that need to be forecasted at Bosch is at the scale of millions. Notice that the top-level time series can be split by either products or regions, creating multiple paths to the bottom level forecasts. The revenue needs to be forecasted at every node in the hierarchy with a forecasting horizon of 12 months into the future. Monthly historical data is available.
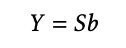
The hierarchical structure can be represented using the following form with the notation of a summing matrix S (Hyndman and Athanasopoulos):
In this equation, Y equals the following:
Here, b represents the bottom level time-series at time t.
Impacts of the COVID-19 pandemic
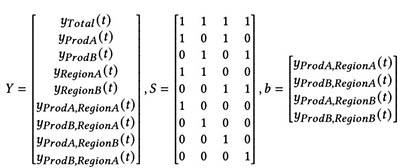
The COVID-19 pandemic brought significant challenges for forecasting due to its disruptive and unprecedented effects on almost all aspects of work and social life. For long-term revenue forecasting, the disruption also brought unexpected downstream impacts. To illustrate this problem, the following figure shows a sample time series where the product revenue experienced a significant drop at the start of the pandemic and gradually recovered afterwards. A typical neural forecasting model will take revenue data including the out-of-distribution (OOD) COVID period as the historical context input, as well as the ground truth for model training. As a result, the forecasts produced are no longer reliable.
Modeling approaches
In this section, we discuss our various modeling approaches.
Amazon Forecast
Forecast is a fully-managed AI/ML service from AWS that provides preconfigured, state-of-the-art time series forecasting models. It combines these offerings with its internal capabilities for automated hyperparameter optimization, ensemble modeling (for the models provided by Forecast), and probabilistic forecast generation. This allows you to easily ingest custom datasets, preprocess data, train forecasting models, and generate robust forecasts. The service’s modular design further enables us to easily query and combine predictions from additional custom models developed in parallel.
We incorporate two neural forecasters from Forecast: CNN-QR and DeepAR+. Both are supervised deep learning methods that train a global model for the entire time series dataset. Both CNNQR and DeepAR+ models can take in static metadata information about each time series, which are the corresponding product, region, and business organization in our case. They also automatically add temporal features such as month of the year as part of the input to the model.
Transformer with attention masks for COVID
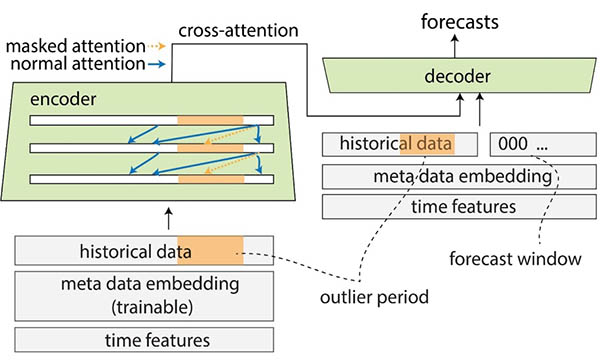
The Transformer architecture (Vaswani et al.), originally designed for natural language processing (NLP), recently emerged as a popular architectural choice for time series forecasting. Here, we used the Transformer architecture described in Zhou et al. without probabilistic log sparse attention. The model uses a typical architecture design by combining an encoder and a decoder. For revenue forecasting, we configure the decoder to directly output the forecast of the 12-month horizon instead of generating the forecast month by month in an autoregressive manner. Based on the frequency of the time series, additional time related features such as month of the year are added as the input variable. Additional categorical variables describing the meta information (product, region, business organization) are fed into the network via a trainable embedding layer.
The following diagram illustrates the Transformer architecture and the attention masking mechanism. Attention masking is applied throughout all the encoder and decoder layers, as highlighted in orange, to prevent OOD data from affecting the forecasts.
We mitigate the impact of OOD context windows by adding attention masks. The model is trained to apply very little attention to the COVID period that contains outliers via masking, and performs forecasting with masked information. The attention mask is applied throughout every layer of the decoder and encoder architecture. The masked window can be either specified manually or through an outlier detection algorithm. Additionally, when using a time window containing outliers as the training labels, the losses are not back-propagated. This attention masking-based method can be applied to handle disruptions and OOD cases brought by other rare events and improve the robustness of the forecasts.
Model ensemble
Model ensemble often outperforms single models for forecasting—it improves model generalizability and is better at handling time series data with varying characteristics in periodicity and intermittency. We incorporate a series of model ensemble strategies to improve model performance and robustness of forecasts. One common form of deep learning model ensemble is to aggregate results from model runs with different random weight initializations, or from different training epochs. We utilize this strategy to obtain forecasts for the Transformer model.
To further build an ensemble on top of different model architectures, such as Transformer, CNNQR, and DeepAR+, we use a pan-model ensemble strategy that selects the top-k best performing models for each time series based on the backtest results and obtain their averages. Because backtest results can be exported directly from trained Forecast models, this strategy enables us to take advantage of turnkey services like Forecast with improvements gained from custom models such as Transformer. Such an end-to-end model ensemble approach doesn’t require training a meta-learner or calculating time series features for model selection.
Hierarchical reconciliation
The framework is adaptive to incorporate a wide range of techniques as postprocessing steps for hierarchical forecast reconciliation, including bottom-up (BU), top-down reconciliation with forecasting proportions (TDFP), ordinary least square (OLS), and weighted least square (WLS). All the experimental results in this post are reported using top-down reconciliation with forecasting proportions.
Architecture overview
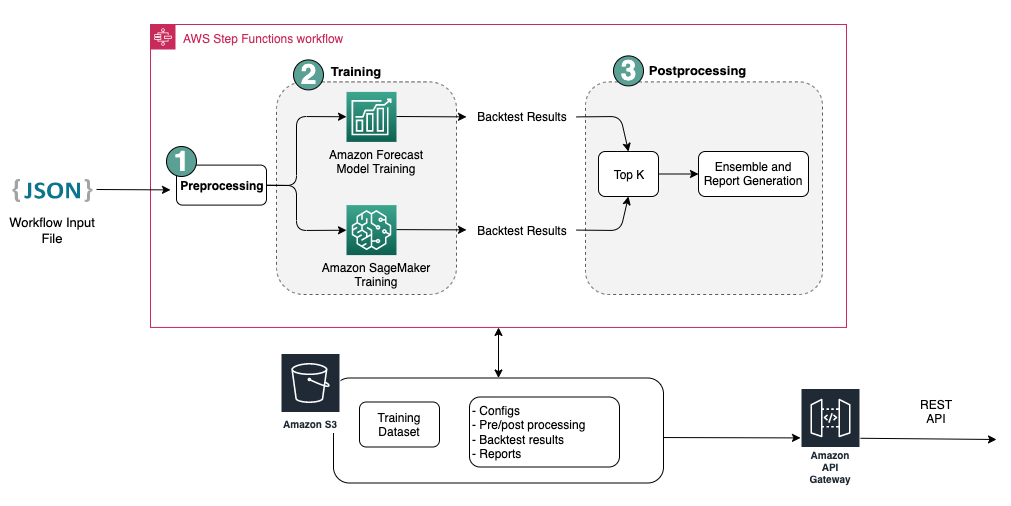
We developed an automated end-to-end workflow on AWS to generate revenue forecasts utilizing services including Forecast, SageMaker, Amazon Simple Storage Service (Amazon S3), AWS Lambda, AWS Step Functions, and AWS Cloud Development Kit (AWS CDK). The deployed solution provides individual time series forecasts through a REST API using Amazon API Gateway, by returning the results in predefined JSON format.
The following diagram illustrates the end-to-end forecasting workflow.
Key design considerations for the architecture are versatility, performance, and user-friendliness. The system should be sufficiently versatile to incorporate a diverse set of algorithms during development and deployment, with minimal required changes, and can be easily extended when adding new algorithms in the future. The system should also add minimum overhead and support parallelized training for both Forecast and SageMaker to reduce training time and obtain the latest forecast faster. Finally, the system should be simple to use for experimentation purposes.
The end-to-end workflow sequentially runs through the following modules:
A preprocessing module for data reformatting and transformation
A model training module incorporating both the Forecast model and custom model on SageMaker (both are running in parallel)
A postprocessing module supporting model ensemble, hierarchical reconciliation, metrics, and report generation
Step Functions organizes and orchestrates the workflow from end to end as a state machine. The state machine run is configured with a JSON file containing all the necessary information, including the location of the historical revenue CSV files in Amazon S3, the forecast start time, and model hyperparameter settings to run the end-to-end workflow. Asynchronous calls are created to parallelize model training in the state machine using Lambda functions. All the historical data, config files, forecast results, as well as intermediate results such as backtesting results are stored in Amazon S3. The REST API is built on top of Amazon S3 to provide a queryable interface for querying forecasting results. The system can be extended to incorporate new forecast models and supporting functions such as generating forecast visualization reports.
Evaluation
In this section, we detail the experiment setup. Key components include the dataset, evaluation metrics, backtest windows, and model setup and training.
Dataset
To protect the financial privacy of Bosch while using a meaningful dataset, we used a synthetic dataset that has similar statistical characteristics to a real-world revenue dataset from one business unit at Bosch. The dataset contains 1,216 time series in total with revenue recorded in a monthly frequency, covering January 2016 to April 2022. The dataset is delivered with 877 time series at the most granular level (bottom time series), with a corresponding grouped time series structure represented as a summing matrix S. Each time series is associated with three static categorical attributes, which corresponds to product category, region, and organizational unit in the real dataset (anonymized in the synthetic data).
Evaluation metrics
We use median-Mean Arctangent Absolute Percentage Error (median-MAAPE) and weighted-MAAPE to evaluate the model performance and perform comparative analysis, which are the standard metrics used at Bosch. MAAPE addresses the shortcomings of the Mean Absolute Percentage Error (MAPE) metric commonly used in business context. Median-MAAPE gives an overview of the model performance by computing the median of the MAAPEs calculated individually on each time series. Weighted-MAAPE reports a weighted combination of the individual MAAPEs. The weights are the proportion of the revenue for each time series compared to the aggregated revenue of the entire dataset. Weighted-MAAPE better reflects downstream business impacts of the forecasting accuracy. Both metrics are reported on the entire dataset of 1,216 time series.
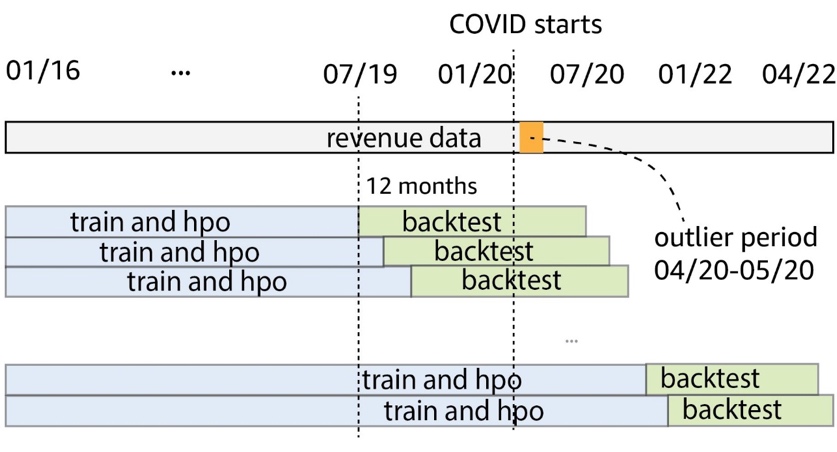
Backtest windows
We use rolling 12-month backtest windows to compare model performance. The following figure illustrates the backtest windows used in the experiments and highlights the corresponding data used for training and hyperparameter optimization (HPO). For backtest windows after COVID-19 starts, the result is affected by OOD inputs from April to May 2020, based on what we observed from the revenue time series.
Model setup and training
For Transformer training, we used quantile loss and scaled each time series using its historical mean value before feeding it into Transformer and computing the training loss. The final forecasts are rescaled back to calculate the accuracy metrics, using the MeanScaler implemented in GluonTS. We use a context window with monthly revenue data from the past 18 months, selected via HPO in the backtest window from July 2018 to June 2019. Additional metadata about each time series in the form of static categorical variables are fed into the model via an embedding layer before feeding it to the transformer layers. We train the Transformer with five different random weight initializations and average the forecast results from the last three epochs for each run, in total averaging 15 models. The five model training runs can be parallelized to reduce training time. For the masked Transformer, we indicate the months from April to May 2020 as outliers.
For all Forecast model training, we enabled automatic HPO, which can select the model and training parameters based on a user-specified backtest period, which is set to the last 12 months in the data window used for training and HPO.
Experiment results
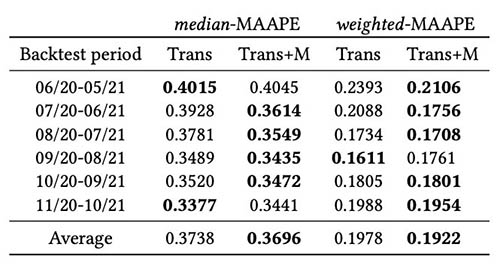
We train masked and unmasked Transformers using the same set of hyperparameters, and compared their performance for backtest windows immediately after COVID-19 shock. In the masked Transformer, the two masked months are April and May 2020. The following table shows the results from a series of backtest periods with 12-month forecasting windows starting from June 2020. We can observe that the masked Transformer consistently outperforms the unmasked version.
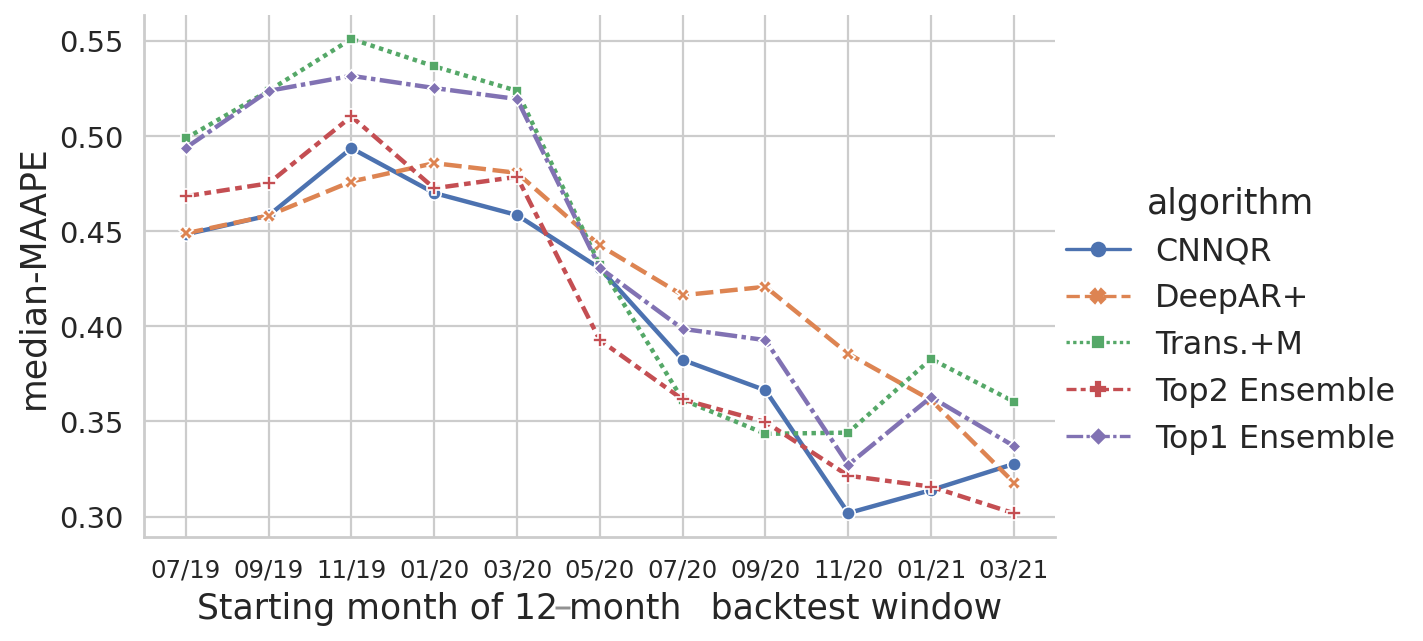
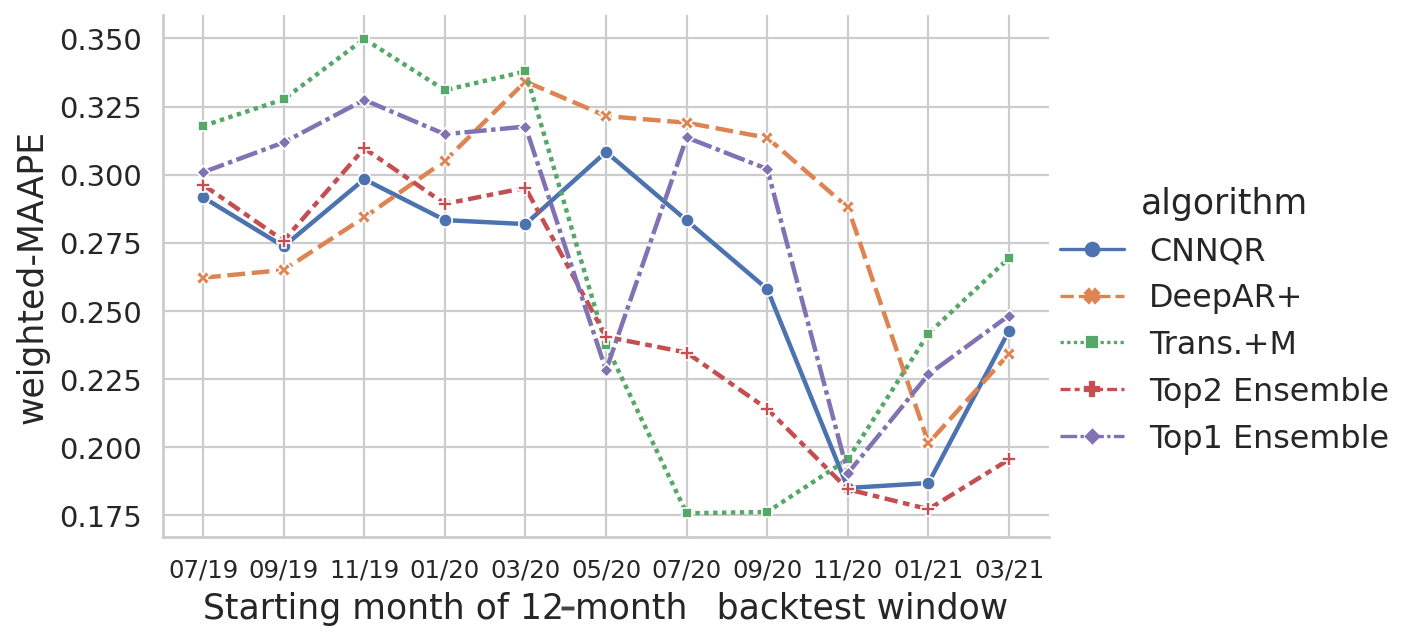
We further performed evaluation on the model ensemble strategy based on backtest results. In particular, we compare the two cases when only the top performing model is selected vs. when the top two performing models are selected, and model averaging is performed by computing the mean value of the forecasts. We compare the performance of the base models and the ensemble models in the following figures. Notice that none of the neural forecasters consistently out-perform others for the rolling backtest windows.
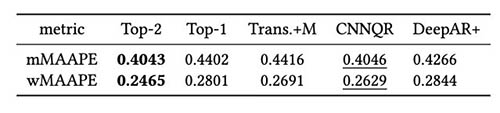
The following table shows that, on average, ensemble modeling of the top two models gives the best performance. CNNQR provides the second-best result.
Conclusion
This post demonstrated how to build an end-to-end ML solution for large-scale forecasting problems combining Forecast and a custom model trained on SageMaker. Depending on your business needs and ML knowledge, you can use a fully managed service such as Forecast to offload the build, train, and deployment process of a forecasting model; build your custom model with specific tuning mechanisms with SageMaker; or perform model ensembling by combining the two services.
If you would like help accelerating the use of ML in your products and services, please contact the Amazon ML Solutions Lab program.
References
Hyndman RJ, Athanasopoulos G. Forecasting: principles and practice. OTexts; 2018 May 8.
Vaswani A, Shazeer N, Parmar N, Uszkoreit J, Jones L, Gomez AN, Kaiser Ł, Polosukhin I. Attention is all you need. Advances in neural information processing systems. 2017;30.
Zhou H, Zhang S, Peng J, Zhang S, Li J, Xiong H, Zhang W. Informer: Beyond efficient transformer for long sequence time-series forecasting. InProceedings of AAAI 2021 Feb 2.
About the Authors
Goktug Cinar is a lead ML scientist and the technical lead of the ML and stats-based forecasting at Robert Bosch LLC and Bosch Center for Artificial Intelligence. He leads the research of the forecasting models, hierarchical consolidation, and model combination techniques as well as the software development team which scales these models and serves them as part of the internal end-to-end financial forecasting software.
Michael Binder is a product owner at Bosch Global Services, where he coordinates the development, deployment and implementation of the company wide predictive analytics application for the large-scale automated data driven forecasting of financial key figures.
Adrian Horvath is a Software Developer at Bosch Center for Artificial Intelligence, where he develops and maintains systems to create predictions based on various forecasting models.
Panpan Xu is a Senior Applied Scientist and Manager with the Amazon ML Solutions Lab at AWS. She is working on research and development of Machine Learning algorithms for high-impact customer applications in a variety of industrial verticals to accelerate their AI and cloud adoption. Her research interest includes model interpretability, causal analysis, human-in-the-loop AI and interactive data visualization.
Jasleen Grewal is an Applied Scientist at Amazon Web Services, where she works with AWS customers to solve real world problems using machine learning, with special focus on precision medicine and genomics. She has a strong background in bioinformatics, oncology, and clinical genomics. She is passionate about using AI/ML and cloud services to improve patient care.
Selvan Senthivel is a Senior ML Engineer with the Amazon ML Solutions Lab at AWS, focusing on helping customers on machine learning, deep learning problems, and end-to-end ML solutions. He was a founding engineering lead of Amazon Comprehend Medical and contributed to the design and architecture of multiple AWS AI services.
Ruilin Zhang is an SDE with the Amazon ML Solutions Lab at AWS. He helps customers adopt AWS AI services by building solutions to address common business problems.
Shane Rai is a Sr. ML Strategist with the Amazon ML Solutions Lab at AWS. He works with customers across a diverse spectrum of industries to solve their most pressing and innovative business needs using AWS’s breadth of cloud-based AI/ML services.
Lin Lee Cheong is an Applied Science Manager with the Amazon ML Solutions Lab team at AWS. She works with strategic AWS customers to explore and apply artificial intelligence and machine learning to discover new insights and solve complex problems.
Read MoreAWS Machine Learning Blog