A reliable system and end-user experience are essential for an organization’s success. Any downtime or degradation of the user experience can impair an organization’s ability to create value for its stakeholders.
As modern applications become more complex, composed of hundreds of microservices, containers, and sub-components, it is critical for application owners to not only monitor the health and performance of the individual components, but also ensure that the application is delivering a reliable and performant end user experience.
To make the monitoring of these applications easier, Google Cloud is excited to announce Cloud Monitoring’s new synthetic monitoring offering, now available in public preview.
What is synthetic monitoring?
Synthetic monitoring is a type of proactive monitoring capability that uses automated scripts to simulate user interactions with an application or service. This allows you to test the availability, consistency, and performance of your web applications, APIs, and key business workflows from the perspective of a real user, on a continuous basis, even during times when traffic is low due to time and seasonality, e.g. night time or holidays.
Synthetic monitoring can be used to:
Identify and fix performance issues before they impact users
Verify that the application is meeting performance SLAs
Detect changes in application behavior
Monitor the application’s availability
How does synthetic monitoring work?
Google Cloud’s synthetic monitoring service works by executing automated scripts that target an application or service from a supported Google Cloud region. The scripts simulate user interactions with the application, such as logging in, searching for a product, or adding an item to the cart. When you configure a synthetic monitor, you create a Google Cloud Function V2 that executes code using NodeJS or Typescript using an open source framework that is distributed and managed by Google Cloud Monitoring.
The results of the scripts are then collected and analyzed to determine the application’s availability, consistency, and performance. If any problems are detected, alerts can be configured to notify the appropriate team so that they can be fixed before they impact your end-users, with detailed reports provided for debugging purposes.
Creating a new synthetic monitor
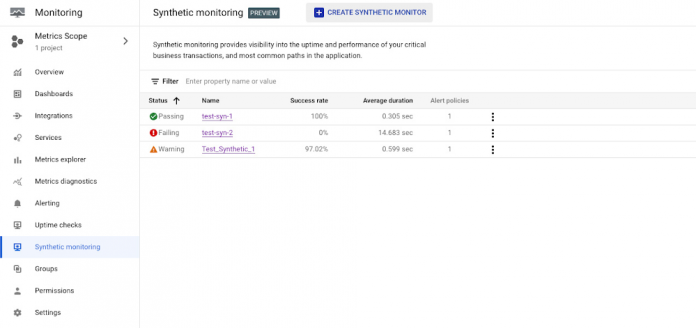
Google Cloud’s synthetic monitoring service is easy to use and can be configured in minutes. To get started, you can head to Monitoring > Synthetic Monitoring and select “+ Create Synthetic Monitor”.
You select the name of the synthetic monitor, its frequency of execution, and other settings.
Next, you create a cloud function that will be the target of the synthetic monitor. By clicking “Apply Function”, a fly out is launched that is used to configure the cloud function. At this step, you may name your function, or manage advanced settings such as the ability for this function to have access to an internal VPC network. You are also met with sample code for the function to execute.
While the example merely makes an http request to an example url, you can author code that interacts with any URL or API endpoint that a cloud function would have the ability to interact with. When writing code, keep in mind that a synthetic monitor will be considered a success if it exits, and a failure if it throws an error. Synthetic monitoring supports development of tests without relying on a specific framework, as well as tests that use the Mocha framework. To write tests that rely on the Mocha framework, you can use the template available at mocha-url-ok.
From this page, you can also create an alerting policy that fires after a synthetic monitor detects two consecutive failures.
Viewing synthetic monitor results
From the Synthetic Monitors page, you can click on the name of a given synthetic monitor to launch its details page. You will be able to view the following:
The average pass rate and duration over a selected time period
An execution history table that contains individual executions, alongside their status, run date, execution time, and the revision id of the cloud function that was interacted with.
A graph plotting the duration over a selected time period
Configuration information for the synthetic monitor
Viewing an individual synthetic monitor execution
From the details page of a synthetic monitor, you can click on an individual execution to view more in depth information about what occurred during the execution. Included is the following:
Information about whether or not the synthetic monitor execution was considered a failure, its run date, its duration, and a link to the cloud function.
View of all of the files that were a part of the cloud function, with a line of code highlighted that is considered to be the starting point of a given failure.
A logs panel that displays logs that are attributed to the execution.
If you use the Mocha framework, then the logs include information about whether the test passed or failed, test duration, and, in the case of failure, a full stack trace. The stack trace includes the line of code that failed, error types, and error messages.
More information
Visit our documentation where you can get additional information and step by step instructions for creating your first synthetic monitor.
Lastly, if you have questions or feedback about this new feature, head to the Cloud Operations Community page and let us know!
Cloud BlogRead More


