

Consistency is one of the most crucial characteristics of relational database systems. Even though every system has their own mechanisms for providing consistency based on the database engine, sometimes you may lack consistency for several reasons, such as I/O hardware and firmware, OS issues, the database engine software, and recovering from UNRECOVERABLE or NOLOGGING database actions. In order to achieve operational excellence, it’s important to know when any corruption happens in your database so you can minimize its impact on database functionality and take corrective actions. To accomplish this, database monitoring for corruption is a must.
Customers running Amazon Relational Database Service (Amazon RDS) for Oracle want to shorten the process of accessing database logs and receive proactive notifications of database alerts. Because Amazon RDS for Oracle doesn’t provide host file system access, direct access to the database logs through host server isn’t available. However, Amazon RDS for Oracle provides a feature to publish database logs to Amazon CloudWatch Logs, which you can access for monitoring and alerting and keeping those logs longer than default retention periods of alert.log . You can then create metric filter alarms to look for corruption error messages in CloudWatch Logs, which enables notifications on corruptions.
In this post, I show you how to create metric filter alarms to trigger Amazon Simple Notification Service (Amazon SNS) notifications when ORA-01578 or ORA-00600 errors are reported in the Oracle alert log through CloudWatch Logs. This solution is a specialized use case of the solution presented in Build proactive database monitoring for Amazon RDS with Amazon CloudWatch Logs, AWS Lambda, and Amazon SNS.
Terminology
Physical corruption is also called media corruption, in which the database doesn’t recognize the block at all. The problem isn’t related to the content but to the physical location or structure itself; for example, a bad header, a fractured or incomplete block, the block checksum is invalid, the block is misplaced, zeroed-out blocks, the header and footer of the block don’t match, one of the key data block data structures is incorrect, such as the data block address, and more.
Logical corruption is also called soft corruption. Oracle marks a block as logical corrupted if it detects an internal inconsistency in the block. The block may have a good header and footer and its checksum is correct, but the block structures may be corrupt.
Oracle marks a data block as corrupted when it’s not in a recognized Oracle Database format, or its contents aren’t internally consistent. Block corruption may affect only a single block or a large portion of the database, and a data block can have physical or logical corruption. Oracle reports any corruption via specific error codes, such as ORA-01578 or ORA-00600, in the alert log only when it touches that block for the first time.
Solution overview
Database administrators generally monitor for keywords like ORA-errors in the alert log of Oracle databases. When a database error occurs, DBAs must be notified as fast as possible of the alert to determine the seriousness of the error and take appropriate action.
The general process to monitor errors in an RDS database is to look for the errors in database error logs on the AWS Management Console. However, this process doesn’t send timely alerts when the error occurs on the databases.
The solution in this post addresses three issues:
Monitoring the RDS for Oracle database for errors ORA-01578 or ORA-00600 that appear in the logs
Streaming the database logs for the RDS for Oracle databases to CloudWatch log groups without having to read the whole file every time to monitor the database
Creating alarms to get notified for Oracle corruption errors based on the CloudWatch log groups
The following diagram illustrates our solution architecture.
CloudWatch log groups enable you to centralize the logs from all of your systems, applications, and AWS services that you use in a single, highly scalable service.
Metric filters define the terms and patterns to look for in log data as it’s sent to CloudWatch Logs. CloudWatch Logs uses these metric filters to turn log data into numerical CloudWatch metrics that you can graph or set an alarm on.
Amazon SNS is a fully managed messaging service for both application-to-application (A2A) and application-to-person (A2P) communication.
For this post, I walk through the process of manually setting up the resources through various AWS services:
Publish the contents of the RDS for Oracle alert log to CloudWatch log groups.
Create metric filter alarms based on the text patterns “ORA-01578” and “ORA-00600” in the log groups.
Prerequisites
For this walkthrough, the following prerequisites are necessary:
An AWS account with RDS for Oracle instances running
RDS for Oracle instances configured to export logs to CloudWatch
An SNS subscription endpoint
Publish an Oracle alert log to CloudWatch Logs
You can publish the alert log of an Oracle database instance to CloudWatch Logs during the creation of instance or If you already have an existing RDS Oracle instance, Choose Modify.
The following screenshot of the Amazon RDS console shows where to select the Alert log option for Log exports, under Additional configuration.
Create a CloudWatch Metric Filter
To create a CloudWatch metric filter, complete the following steps:
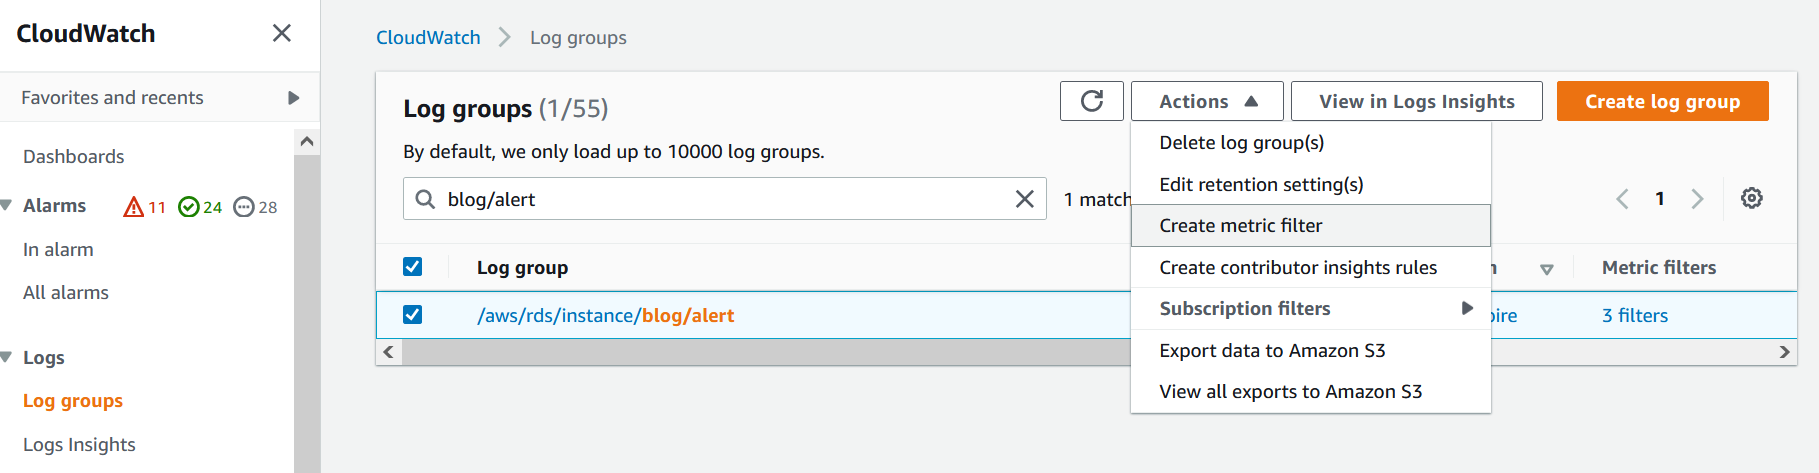
On the CloudWatch console, choose Log groups in the navigation pane.
Search for and select your instance (RDS instance name in this post is “blog”).
On the Actions menu, choose Create metric filter.
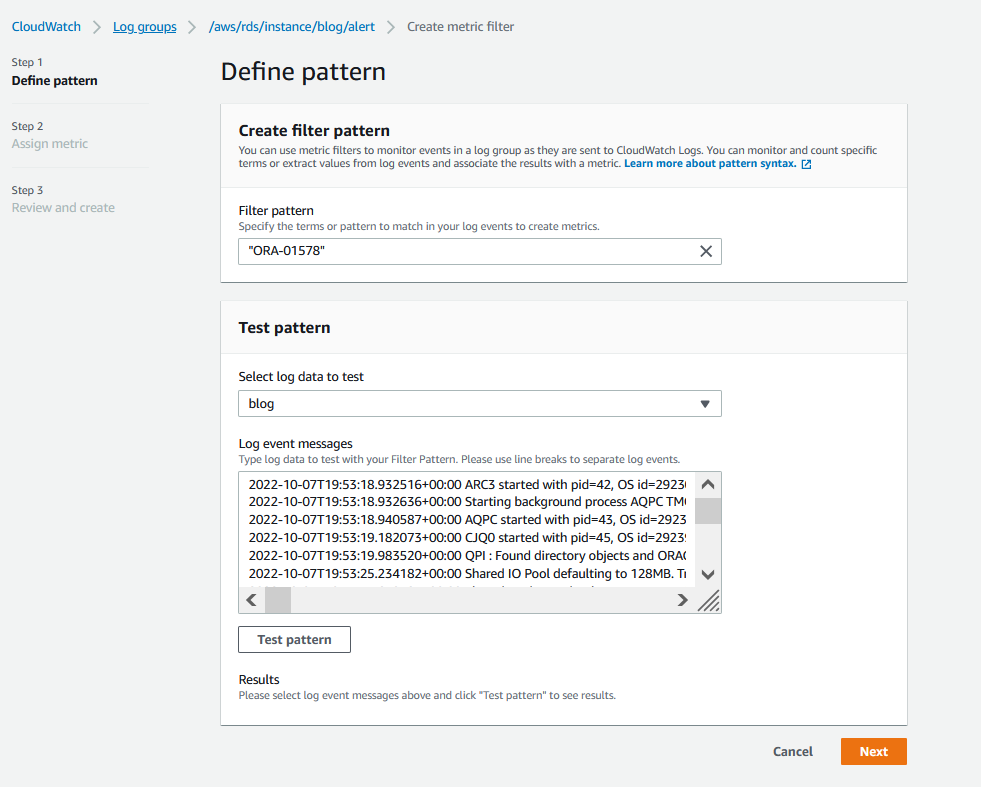
For Filter pattern, specify ORA-01578 within the double quotes as “ORA-01578” to match the exact Oracle error message related to regarding corruption.
Choose Next.
In the Metrics details section, provide the details of your metrics to match the pattern “ORA-01578”.
Choose Next.
Review the configuration, then choose Save changes.
Repeat these steps to create a filter based on the text pattern “ORA-00600”, which reflects logical corruption if you want to add another filter based on that type of corruption.
Optionally, you can enable additional filter based upon common ORA errors: Example : ORA-01142
Now you’re ready to create your alarm.
Create a CloudWatch Alarm
On the CloudWatch console, choose Log groups in the navigation pane.
Search for and select your instance (RDS instance name in this post is “blog”).
Choose relevant log groups.
Click Metric Filters.
Create alarms based on those metric filters by selecting the relevant metric filter and choosing Create alarm.
On the Specify metric and conditions page, specify your metric information and conditions, then choose Next. For Datapoints to alarm, specify how many evaluation periods (data points) must be in the ALARM state to trigger the alarm. To create an alarm within 5-minute intervals if ORA-01578 is found at least one time out of datapoints within 5 minutes, you need to enter 1s in the Datapoints To Alarm.
With this configuration, the alarm condition is ORA01578 > 1 for 1 datapoints within 5 minutes.
On the Configure actions page, provide information about notifications and other details, then choose Next. You can use existing Amazon SNS or create a new topic by using the Create new topic option in the Configure actions page.
On the Add name and description page, enter a name and optional description, then choose Next. In this post, ORA01578 is used.
Review your settings and create your alarm.
Testing the Setup
In order to put the specific error code or a pattern into the alert.log of the instance, the SYS.DBMS_SYSTEM.KSDWRT procedure can be used by running it as SYS.DBMS_SYSTEM.KSDWRT (2, ‘ORA-01578’). In this way, you may have chance to test your alarm without waiting for it happen.
With the help of alarms on metric filters, you can receive emails notifying you that ORA-01578 or ORA-00600 errors have been seen in the alert log. The notifications are sent to the email you configure as an endpoint via Amazon SNS. The following screenshot shows an example email.
To create similar automation by subscribing other resources to the SNS topic is possible with Lambda functions as well.
Clean up
Several of the services discussed in this post fall within the AWS Free Tier, so you only incur charges for those services after you exceed the Free Tier usage limits. RDS Oracle is not a service falling with the AWS Free Tier. For this reason, for test purposes, you need to know you are billed for RDS Oracle service. CloudWatch Logs are kept indefinitely and never expire by default. That’s why, relevant log groups can be kept based on retention period or deleted.
You can find detailed pricing on the Amazon RDS, Amazon SNS, and Amazon CloudWatch pricing pages.
To avoid incurring any unexpected charges, you should delete any unused resources.
Summary
In this post, I showed you how to create metric filter alarms for Oracle corruption errors ORA-01578 and ORA-00600 through CloudWatch Logs for an RDS for Oracle database. You can use this monitoring and alerting solution to set up custom alerts for any specific database patterns that appear in the Oracle alert logs. You can make us of this solution to capture specific error codes for Oracle database engine but also specific patterns which is written by your administrative scripts based on your customer administrative scripts in the database level.
Do you have follow-up questions or feedback? Leave a comment. We’d love to hear your thoughts and suggestions.
About the Author
Belma Canik is a Database Specialist Technical Account Manager (STAM) at Amazon Web Services. She helps customers run optimized workloads on AWS and make the best out of their cloud journey.
Read MoreAWS Database Blog