

Organizations of all sizes and across all industries gather and analyze metrics or key performance indicators (KPIs) to help their businesses run effectively and efficiently. Operational metrics are used to evaluate performance, compare results, and track relevant data to improve business outcomes. For example, you can use operational metrics to determine application performance (the average time it takes to render a page for an end user) or application availability (the duration of time the application was operational). One challenge that most organizations face today is detecting anomalies in operational metrics, which are key in ensuring continuity of IT system operations.
Traditional rule-based methods are manual and look for data that falls outside of numerical ranges that have been arbitrarily defined. An example of this is an alert when transactions per hour fall below a certain number. This results in false alarms if the range is too narrow, or missed anomalies if the range is too broad. These ranges are also static. They don’t change based on evolving conditions like the time of the day, day of the week, seasons, or business cycles. When anomalies are detected, developers, analysts, and business owners can spend weeks trying to identify the root cause of the change before they can take action.
Amazon Lookout for Metrics uses machine learning (ML) to automatically detect and diagnose anomalies without any prior ML experience. In a couple of clicks, you can connect Lookout for Metrics to popular data stores like Amazon Simple Storage Service (Amazon S3), Amazon Redshift, and Amazon Relational Database Service (Amazon RDS), as well as third-party software as a service (SaaS) applications (such as Salesforce, Dynatrace, Marketo, Zendesk, and ServiceNow) via Amazon AppFlow and start monitoring metrics that are important to your business.
This post demonstrates how you can connect to your IT operational infrastructure monitored by Dynatrace using Amazon AppFlow and set up an accurate anomaly detector across metrics and dimensions using Lookout for Metrics. The solution allows you to set up a continuous anomaly detector and optionally set up alerts to receive notifications when anomalies occur.
Lookout for Metrics integrates seamlessly with Dynatrace to detect anomalies within your operational metrics. Once connected, Lookout for Metrics uses ML to start monitoring data and metrics for anomalies and deviations from the norm. Dynatrace enables monitoring of your entire infrastructure, including your hosts, processes, and network. You can perform log monitoring and view information such as the total traffic of your network, the CPU usage of your hosts, the response time of your processes, and more.
Amazon AppFlow is a fully managed service that provides integration capabilities by enabling you to transfer data between SaaS applications like Datadog, Salesforce, Marketo, and Slack and AWS services like Amazon S3 and Amazon Redshift. It provides capabilities to transform, filter, and validate data to generate enriched and usable data in a few easy steps.
Solution overview
In this post, we demonstrate how to integrate with an environment monitored by Dynatrace and detect anomalies in the operation metrics. We also determine how application availability and performance (resource contention) were impacted.
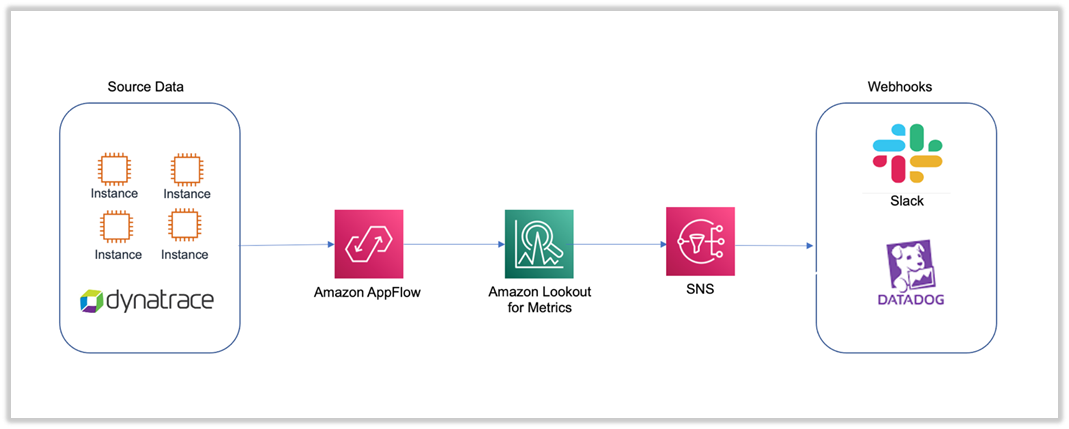
The source data is a cluster of Amazon Elastic Compute Cloud (Amazon EC2) instances that is monitored by Dynatrace. Each EC2 instance is installed with Dynatrace OneAgent to collect all monitored telemetry data (CPU utilization, memory, network utilization, and disk I/O). Amazon AppFlow enables you to securely integrate SaaS applications like Dynatrace and automate data flows, while providing options to configure and connect to such services natively from the AWS Management Console or via API. In this post, we focus on connecting to Dynatrace as our source and Lookout for Metrics as the target, both of which are natively supported applications in Amazon AppFlow.
The solution enables you to create an Amazon AppFlow data flow from Dynatrace to Lookout for Metrics. You can then use Lookout for Metrics to detect any anomalies in the telemetry data, as shown in the following diagram. Optionally, you can send automated anomaly alerts to AWS Lambda functions, webhooks, or Amazon Simple Notification Service (Amazon SNS) topics.
The following are the high-level steps to implement the solution:
Set up Amazon AppFlow integration with Dynatrace.
Create an anomaly detector with Lookout for Metrics.
Add a dataset to the detector and integrate Dynatrace metrics.
Activate the detector.
Create an alert.
Review the detector and data flow status.
Review and analyze any anomalies.
Set up Amazon AppFlow integration with Dynatrace
To set up the data flow, complete the following steps:
On the Amazon AppFlow console, choose Create flow.
For Flow name, enter a name.
For Flow description, enter an optional description.
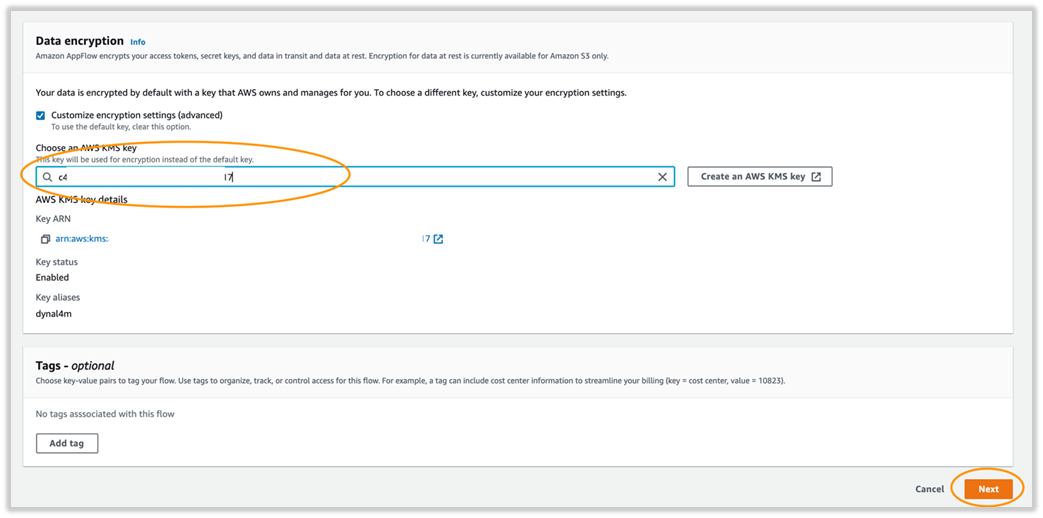
In the Data encryption section, you can choose or create an AWS Key Management Service (AWS KMS) key.
Choose Next.
For Source name, choose Dynatrace.
For Choose Dynatrace Connection, choose the connection you created.
For Choose Dynatrace object, choose Problems (this is the only object supported as of this writing).
For more information about Dynatrace problems, see Problem overview page.
For Destination name, choose Amazon Lookout for Metrics.
For API token, generate an API token from the Dynatrace console.
For Subdomain, enter your Dynatrace portal URL address.
For Data encryption, choose the AWS KMS key.
For Connection Name, enter a name.
Choose Connect.
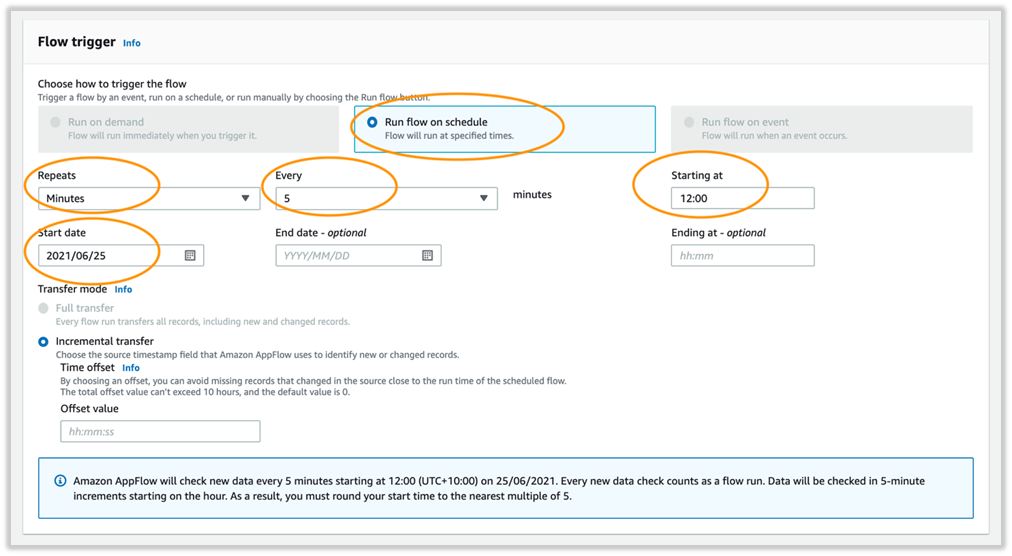
For Flow trigger, select Run flow on schedule.
For Repeats, choose Minutes (alternatively, you can choose hourly or daily).
Set the trigger to repeat every 5 minutes.
Enter a starting time.
Enter a start date.
Dynatrace requires a between date range filter to be set.
For Field name, choose Date range.
For Condition, choose is between.
For Criteria 1, choose your start date.
For Criteria 2, choose your end date.
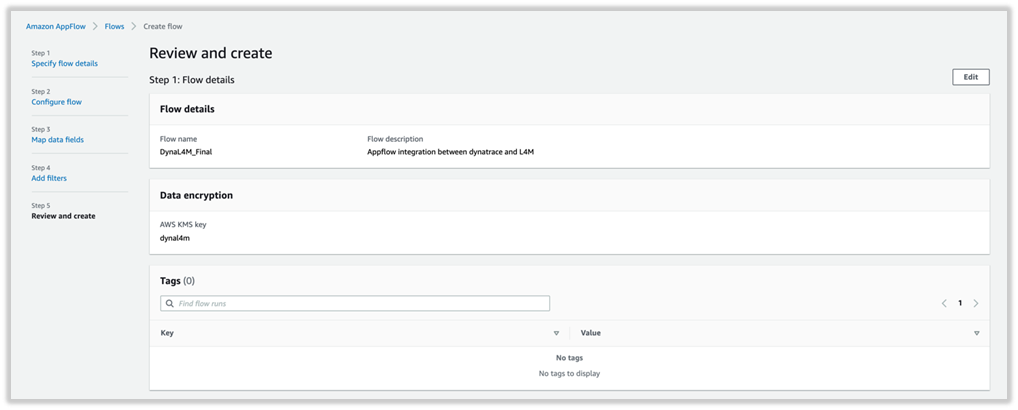
Review your settings and choose Create flow.
Create an anomaly detector with Lookout for Metrics
To create your anomaly detector, complete the following steps:
On the Lookout for Metrics console, choose Create detector.
For Detector name, enter a name.
For Description, enter an optional description.
For Interval, choose the time between each analysis. This should match the interval set on the flow.
For Encryption, create or choose an existing AWS KMS key.
Choose Create.
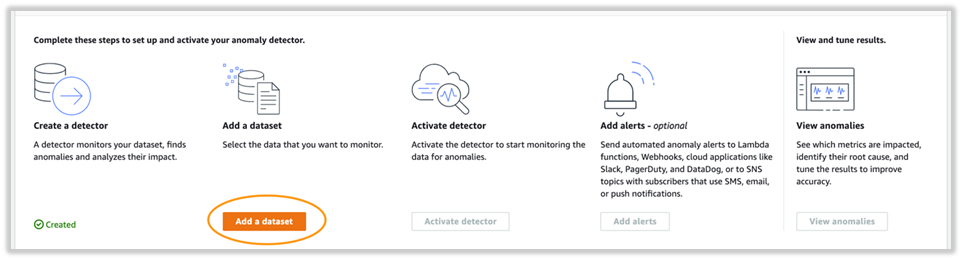
Add a dataset to the detector and integrate Dynatrace metrics
The next step in activating your anomaly detector is to add a dataset and integrate the Dynatrace metrics.
On the detector details, choose Add a dataset.
For Name, enter the data source name.
For Description, enter an optional description.
For Timezone, choose the time zone relevant to your dataset. This should match the time zone used in Amazon AppFlow (which picks up from the browser).
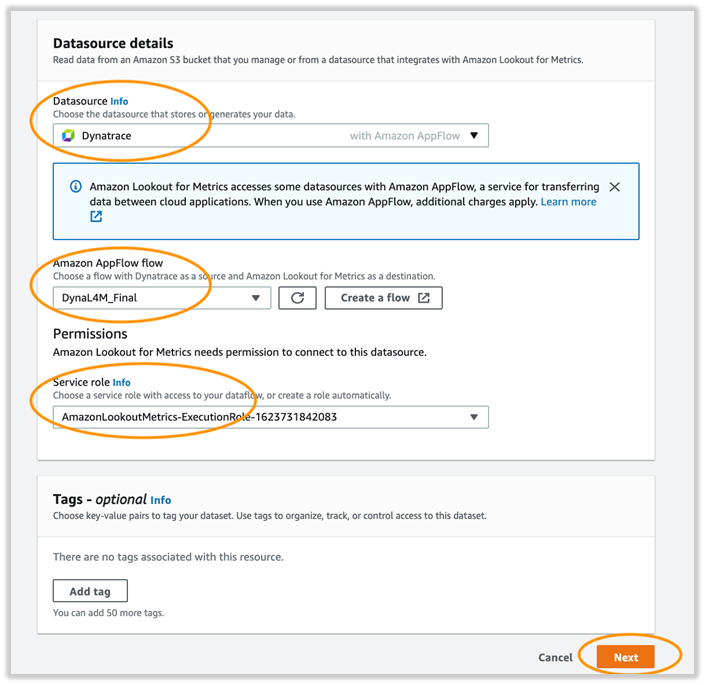
For Datasource, choose Dynatrace.
For Amazon AppFlow flow, choose the flow that you created.
For Permissions, choose a service role.
Choose Next.
For Map fields, the detector tracks 5 measures; in this example I choose impactLevel and hasRootCause.
The map fields are the primary fields that the detector monitors. The fields that are relevant to monitor from an operational KPI should be considered.
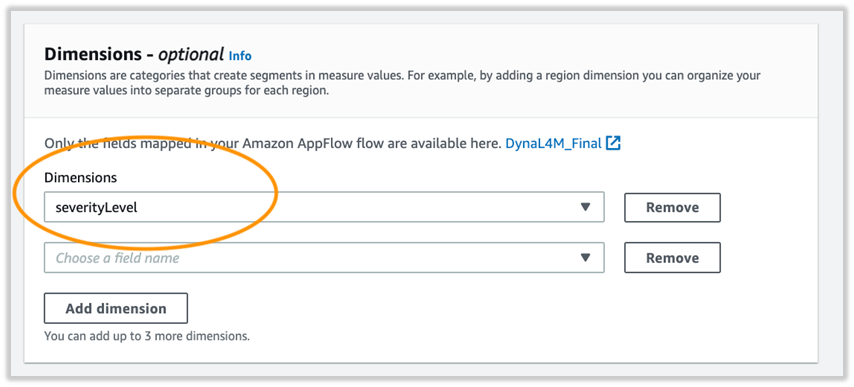
For Dimensions, the detector creates segments in measure values. For this post, I choose severityLevel.
Review the settings and choose Save dataset.
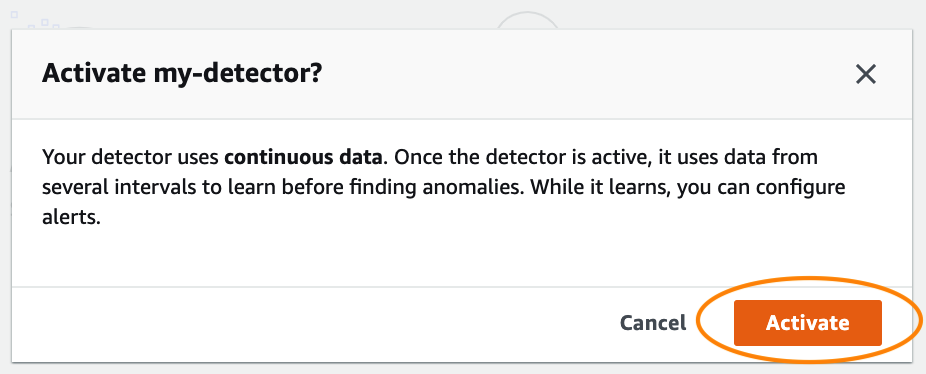
Activate the detector
You’re now ready to activate the newly created detector.
Create an alert
You can create an alert to send automated anomaly alerts to Lambda functions; webhooks; cloud applications like Slack, PagerDuty, and DataDog; or to SNS topics with subscribers that use SMS, email, or push notifications.
On the detector details, choose Add alerts.
For Alert Name, enter the name.
For Sensitivity threshold, enter a threshold at which the detector sends anomaly alerts.
For Channel, choose either Amazon SNS or Lambda as the notification method. For this post, I use Amazon SNS.
For SNS topic, create or choose an existing SNS topic.
For Service role, choose an execution role.
Choose Add alert.
Review the detector and flow status
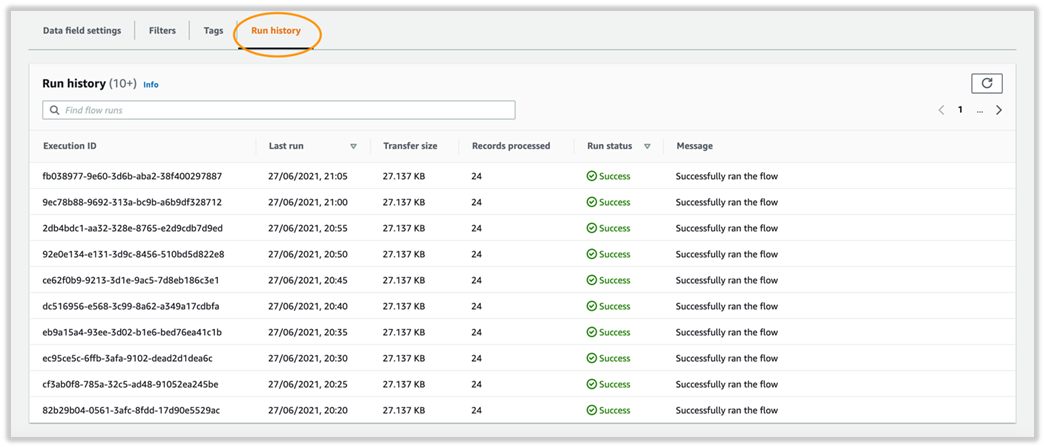
On the Run history tab, you can confirm that the flows are running successfully for the interval chosen.
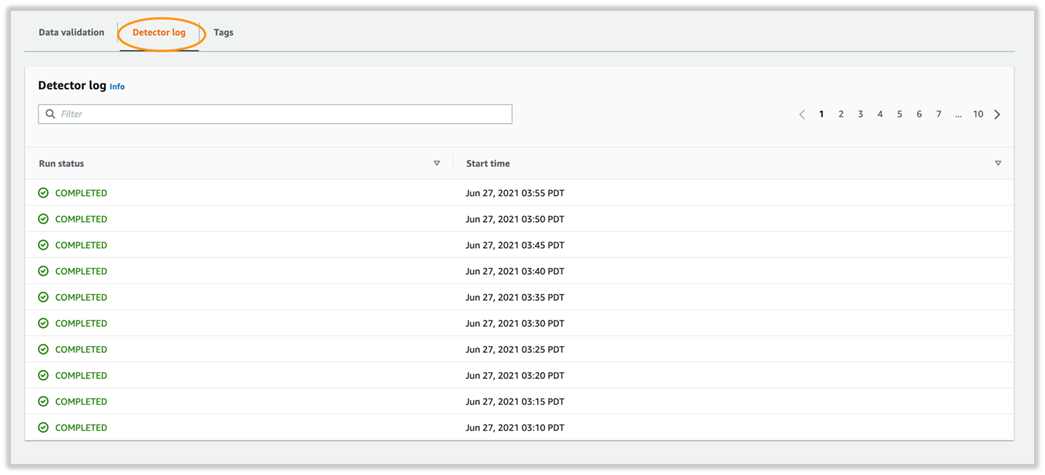
On the Detector log tab, you can confirm that the detector records the results after each interval.
Review and analyze any anomalies
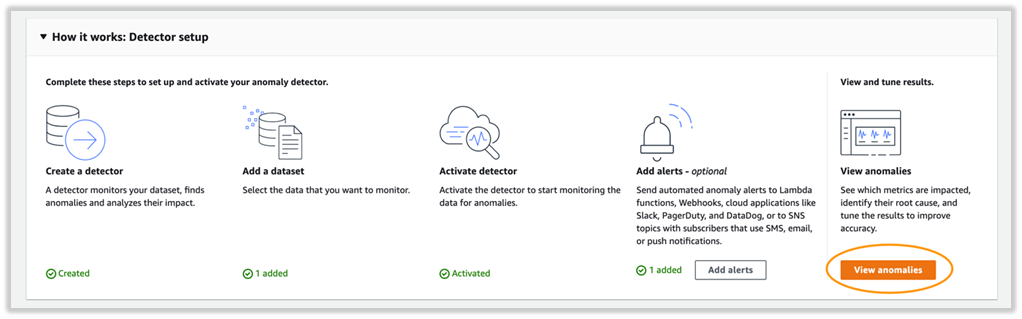
On the main detector page, choose View anomalies to review and analyze any anomalies.
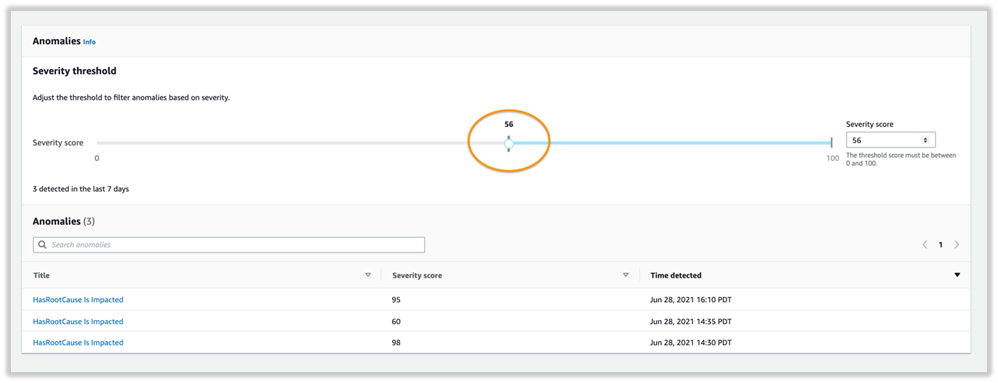
On the Anomalies page, you can adjust the severity score on the threshold dial to filter anomalies above a given score.
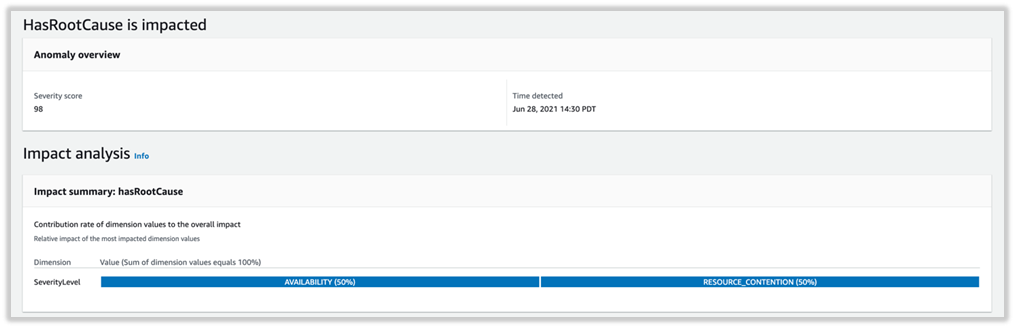
The following analysis represents the severity level and impacted metrics. The graph suggests anomalies detected by the detector with the availability and resource contention being impacted. The anomaly was detected on June 28 at 14:30 PDT and has a severity score of 98, indicating a high severity anomaly that needs immediate attention.
Lookout for Metrics also allows you to provide real-time feedback on the relevance of the detected anomalies, which enables a powerful human-in-the-loop mechanism. This information is fed back to the anomaly detection model to improve its accuracy continuously, in near-real time.
Conclusion
Anomaly detection can be very useful in identifying anomalies that could signal potential issues within your operational environment. Timely detection of anomalies can aid in troubleshooting, help avoid loss in revenue, and help maintain your company’s reputation. Lookout for Metrics automatically inspects and prepares the data, selects the best-suited ML algorithm, begins detecting anomalies, groups related anomalies together, and summarizes potential root causes.
To get started with this capability, see Amazon Lookout for Metrics. You can use this capability in all Regions where Lookout for Metrics is publicly available. For more information about Region availability, see AWS Regional Services.
About the Author
Sumeeth Siriyur is a Solutions Architect based out of AWS, Sydney. He is passionate about infrastructure services and uses AI services to influence IT infrastructure observability and management. In his spare time, he likes binge-watching and works to continually improve his outdoor sports.
Read MoreAWS Machine Learning Blog