In 2019, Instagram launched a new app for direct messaging called Threads. We built media sends in Threads using a lot of the existing infrastructure at Instagram. Many of these components do not focus on the send latency. For this post, we’ll define “send latency” as the time it takes from when the user starts a send to when it is first available to other users. For instance, when a user posts to their Feed, the goal is that the post is available for others to see in a reasonable amount of time. However in the direct messaging case, if a message sends faster, then users can spend less time waiting and more time engaging with others.
To provide a better user experience, my team, Media Infrastructure, teamed up with the Threads team to cut the latency of Threads sends in half by optimizing our existing infrastructure. We shipped many improvements over the half to achieve this. For this post, we’ll highlight one from the server side.
Server media ingestion
During a media send, one of the responsibilities of the server is to write the necessary ingestion information to our data store. This is so that when another user attempts to view the media at delivery time, we can render it for them.
We write this ingestion information for a media send in an endpoint we will call the “configure” endpoint. This endpoint is on the critical path for media sends. Improvements to the execution latency of this endpoint will impact the end-to-end send latency. We knew early on that we needed to speed up this endpoint to achieve our goals given it was responsible for a large part of the total send latency.
Investigation
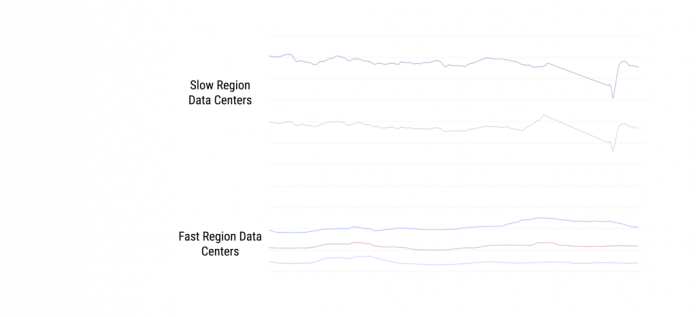
When we started digging into how to shave down this endpoint’s execution time, we stumbled upon something interesting. We saw that this endpoint took four times longer to execute in one region’s data centers than in another. Below shows the graph of endpoint execution time grouped by region:
From this, the first thought was that we were incurring a round trip between regions somewhere. However we weren’t sure if the roundtrip was necessary or why it was having such a huge impact. A single trip shouldn’t have added that much latency.
To get a better idea of where the execution time was going, we queried for the following graph which shows where the execution time was being spent. Turns out the endpoint was spending a lot of time waiting on IO. In particular, it was coming from the database we use to store metadata.
Now things were starting to make sense! One of the properties of this database is that we built it optimized for reads rather than writes. This is because it is a write-through cache. When a read comes in, we get it from the cache. On the other hand, when a write comes in, we’ll need to propagate the write to a backing store to maintain cache consistency. Therefore, the configure endpoint was incurring a round trip between data centers for every write by design. In this case, the backing store resides in the faster region. Since these round trips were longer for the slower region, the theory was that this added up enough so that the endpoint was taking four times as long.
The round trip to the faster region is unavoidable without having backing stores in the slower region’s data centers, which was not a viable solution. However, we theorized we could effectively batch these round trips by instead routing the initial web request for this endpoint to the faster region. Once there, this endpoint would save a lot of time on all writes.
Testing our theory
For any major change, we always want to conduct an A/B test to be able to quickly revert the change in case of regression and to measure the impact. One problem we ran into along the way was that our routing layer doesn’t allow for any sophisticated user-aware A/B test. To get around this, we used the following test setup:
With these in place, we were able to safely measure the impact of our change to confirm our theory.
Results and conclusion
From the test results, we saw significant improvements to send latency for these requests. On average we were seeing send latency wins of around 29 percent overall, which confirmed our theory. By making these media sends faster, we were able to provide a better experience for our users to help them connect with others.
Over the years, we have developed more features for our products, always with a focus on craft. Performance is one of the ways that we provide delightful experiences for our users. There is always potential for impact considering the scale of Instagram, where many of our over one billion users create or consume media every day. If this sounds interesting to you, join us!
Many thanks to my team members, Chris Ellsworth, Rex Jin, Jaed Uavechanichkul, Colin Kalnasy, Ronald Anthony, Alec Blumenthal and Abdul Syed who helped achieve our aggressive performance goal.
The post Cutting Threads’ send latency in half appeared first on Engineering at Meta.
Read MoreEngineering at Meta


