

Many software as a service (SaaS) customers on AWS are familiar with multi-tenancy and tenant isolation. Indeed, customers using MySQL, for instance, may have adopted the bridge model of multi-tenancy, where each tenant has access to their own isolated database or schema. AWS provides many tools and best practices to get started, but achieving database tenant isolation at scale can become a challenge, especially when frequent, concurrent connections cause timeouts and latencies.
Amazon RDS Proxy is a fully managed, highly available database proxy that makes applications more scalable, more secure, and more resilient to database failures. This post focuses on the first two benefits, namely improving scalability by pooling and sharing database connections, and improving security through using AWS Identity and Access Management (IAM) authentication and AWS Secrets Manager. This post also uses RDS Proxy reader endpoints, which connect to Amazon Aurora replicas. The provided solution uses multi-tenancy with Amazon Aurora MySQL-Compatible Edition, but you can apply RDS Proxy to both single and multi-tenant databases using MySQL and PostgreSQL on Amazon Relational Database Service (Amazon RDS) and Aurora.
In this post, we walk through a multi-tenant deployment of an Aurora MySQL Compatible and RDS Proxy architecture. We illustrate tenant isolation in Aurora, and load test its effectiveness by comparing it to an identical deployment without RDS Proxy. We have included an AWS CloudFormation template that provides the resources for you to follow and replicate the demo.
By reading and following along with this post, you create and load test a multi-tenant database proxy solution, and compare the metrics that are relevant to your business. You will also learn how to use IAM authentication with Aurora and RDS Proxy, as well as increase your knowledge on AWS Lambda, Amazon CloudWatch, Amazon API Gateway, AWS X-Ray, and Secrets Manager.
Overview of solution
The solution consists of three Amazon Virtual Private Clouds (Amazon VPCs), as illustrated in the following architecture diagram.
The VPCs are as follows:
Proxy VPC – This VPC includes Lambda, RDS Proxy, Aurora, and an Amazon VPC endpoint that connects to Secrets Manger resources, which together create a multi-tenant access layer at scale. It includes a Lambda access function, in either Node.js or Python, that handles the tenant data access. AWS Security Token Service (AWS STS), IAM roles, and IAM session policies are used to determine and provide access to the correct database or schema for each tenant. The Aurora cluster includes three instances: one writer and two Aurora replicas (by default the db.r5.large instance class) that sit behind the RDS Proxy reader endpoint used in the load test.
No Proxy VPC – This VPC is an identical architecture to the Proxy VPC, except without RDS Proxy and Secrets Manager. This means that the Lambda functions make calls to the Aurora reader endpoint directly, rather than to the RDS Proxy reader endpoint.
Load Test VPC – This VPC uses an open-source Python distributed load testing tool called Locust. Locust is installed on a fleet of Amazon Elastic Compute Cloud (Amazon EC2) instances in a primary-worker configuration to send concurrent requests to the Proxy and No Proxy VPCs, allowing you to compare performance for yourself. These instances send the load to an API Gateway, which forwards the requests to the Proxy and No Proxy VPCs.
The architecture also includes shared services used for monitoring the resources of the load test, namely X-Ray, CloudWatch, Amazon RDS Performance Insights, and the Locust dashboard.
Collectively, these VPCs enable you to deploy your own architecture and visualize the benefits. Furthermore, the CloudFormation template gives you the option to deploy the Proxy VPC only, in order to create a standalone RDS Proxy and access layer.
To deploy and run the solution, we will do the following:
Deploy the CloudFormation template and connect to the Locust dashboard.
Explore the tenant isolation of the solution.
Run the load test and analyze results using the dashboard, CloudWatch, and X-Ray.
Prerequisites
For this walkthrough, you should have the following:
An AWS account.
Basic knowledge of Lambda and either Python or Node.js.
Knowledge of multi-tenancy with MySQL (for more information on this and other data partitioning topics, see Data Partitioning).
The CloudFormation template creates three Amazon VPCs, three internet gateways, and three Elastic IP addresses. Because the default limit for these are five in most Regions, we recommend deploying in a Region where you have few Amazon VPCs, or one where you have raised all of these limits accordingly. For more information about these limits, see Amazon VPC quotas. The three VPCs are created here for illustration purposes. In a real-world scenario, this number can be reduced.
The Load Test and Proxy VPCs are for load testing only, and should be deleted after testing. The resources in the Proxy VPC provide a reference access layer, and can be retained even when the Load Test and Proxy VPCs are deleted, but don’t include various features that should be seen in a production environment, including authorization and authentication at all layers (for more information on how to implement this, see Managing SaaS Identity Through Custom Attributes and Amazon Cognito). Other factors to be aware of in a production environment are discussed at the end of this post.
Deploy the CloudFormation template
Deploy the template by choosing Launch Stack:
Further information about the stack, including stack parameters, supported Regions, a breakdown of costs, as well as all of the code used, can be found in the GitHub repository. We recommend reading the README file before deploying.
One of the key parameters in the CloudFormation template is Create Load Test Stack, which if True deploys all of the components represented in the architecture, including all of the necessary IAM roles, Amazon EC2 security groups, VPC subnets, and an Amazon EC2 Spot Fleet running Locust for load testing. It also creates Secrets Manager secrets and dummy data for both the Proxy and No Proxy databases.
The parameter is True by default. If set to False, the template deploys only the Proxy VPC in the architecture diagram, also including all the IAM roles, Amazon EC2 security groups, and VPC subnets to facilitate communication with minimal permissions. Setting the parameter to False won’t add dummy data to the databases, allowing you to add your own MySQL data instead. Setting the parameter to True, in contrast, populates both databases, thereby allowing you to easily load test by following along with this blog. Choosing the Launch Stack button allows you to deploy the Proxy VPC with or without the load test stack into your own AWS account.
The template (if also deploying the load test stack) creates dummy data for both the Proxy and No Proxy databases. It creates 200 tenants by default (200 users in MySQL terminology), and 200 databases, one database per tenant. It also creates by default 200 Secrets Manager secrets, which is the maximum that can be associated with a single RDS Proxy (explained later). In each database it creates a table that contains 1,000 rows, each row filled with random integers. This uses the Aurora writer instance that is created in both clusters. Two Aurora replicas are also created for each cluster, and it is with these that the clusters are compared, by sending SELECT statements from the Load Test VPC to both the RDS Proxy reader endpoint for the Proxy VPC, and the Aurora reader endpoint for the No Proxy VPC.
For the No Proxy VPC, the template creates tenants using an AWS authentication token instead of a password. This uses an AWS-provided plugin that works seamlessly with IAM to authenticate the users and tenants. For more information, see Creating a database account using IAM authentication. When accessing the tenant data, it allows the Lambda function (as seen in the architecture diagram) to call AWS STS AssumeRole to dynamically create an IAM session policy that scopes the permissions of the tenant down to only allow access to their own database. It does this by specifying the tenant ID within the resource component of the policy. For further information, see Creating and using an IAM policy for IAM database access.
For the Proxy VPC, IAM authentication is also used, but instead in the connection between Lambda and RDS Proxy (rather than between Lambda and the Aurora replicas directly). What differs here is that RDS Proxy then retrieves the tenant ID and fetches the securely stored password in Secrets Manager for that tenant. RDS Proxy uses native authentication (username and password, without using IAM) to establish a connection to the Aurora replicas via its warm connection pool. Consequently, for the Proxy database, the template creates users using a randomly generated password, and stores these credentials in Secrets Manager, one for each user.
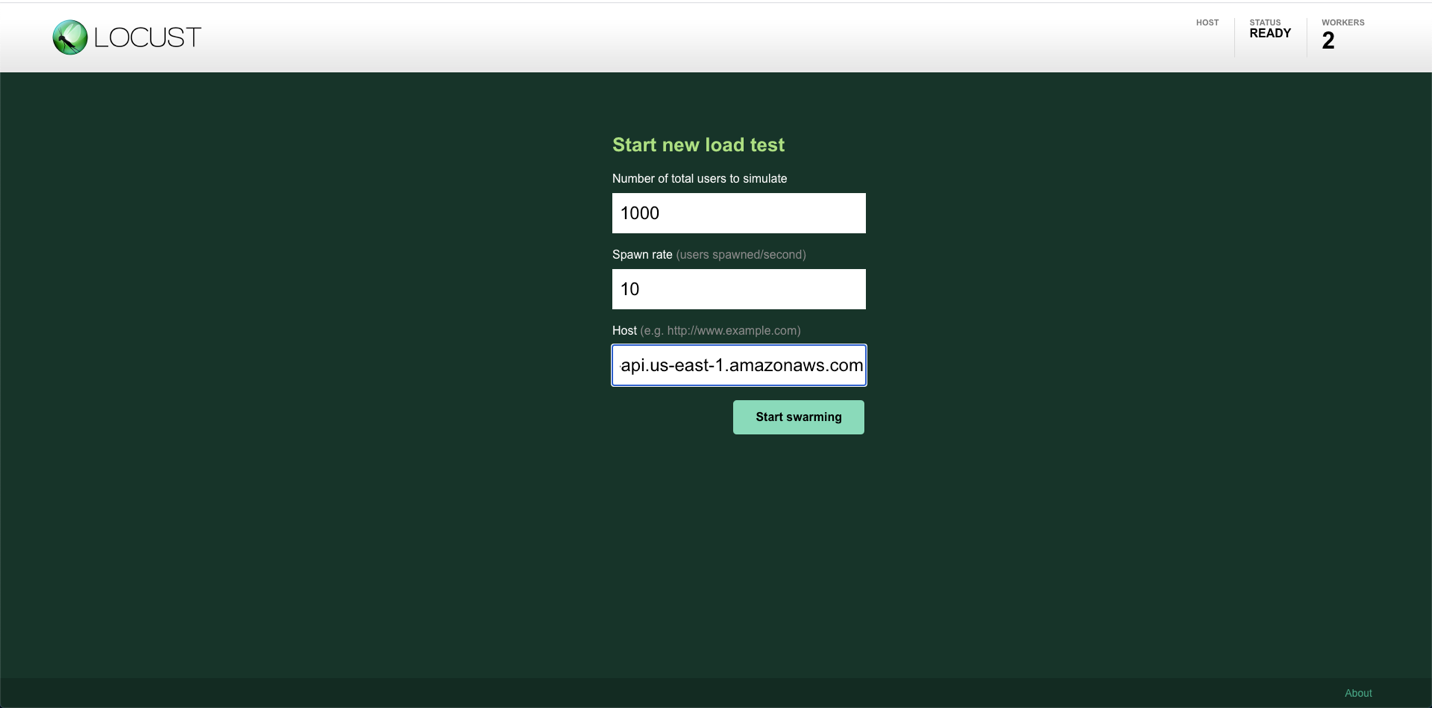
After deployment, navigate to the Outputs tab on the CloudFormation console (unselecting the option for View nested makes finding the main stack, named rds-proxy-load-test, much easier), find the LocustAddress value, and open the URL in a web browser. This navigates you to the Locust dashboard, which looks like the following screenshot.
For Number of total users to simulate and Spawn rate, you can choose your own values, but a good starting point would be 1,000 and 10, respectively. We recommend using these values unless you have raised the default limit for Lambda concurrent connections. You may also want to increase the value of the stack parameter Locust Worker Instances if you want more than 7,500 users. You will tend to see greater differences between the Proxy and No Proxy databases as the number of users increase, however this also increases the likelihood of Lambda throttles with default limits. For more information about the Lambda limits, see Lambda quotas. For definitions:
Number of total users to simulate – The number of users that are tested simultaneously after they’re all spawned. Here, a user is an entity that makes a request for a random tenant, waits several seconds, and repeats. In this case a user can be considered to be a bot that continuously makes API requests, and is very different from the 200 tenants or MySQL users for which we have isolated databases.
Hatch rate – The number of additional users to simulate every second until the total number of users equals the total number you specified. For example, specifying 1,000 and 10 simulates 10 additional users every second, simulating the full 1,000 after 100 seconds.
For Host, enter the APIGatewayURL value from the Outputs tab on the CloudFormation console.
Before beginning the load test, let’s explore the tenant isolation of the architecture.
Explore the tenant isolation
After deploying the template (with the load test stack), the databases are populated with dummy data. Find the name of the created Lambda function on the Outputs tab (NoProxyLambdaName) on the CloudFormation console, navigate to Lambda in the AWS Management Console, and select the deployed function. This displays the code used to access the tenant data. This post uses Node.js, but the process for Python is the same. The code performs the following actions:
Extract the tenant ID from the tenant.
Generate a database token using AWS STS.
Use this token as a password to create a connection to the Aurora cluster or RDS Proxy.
The majority of this code uses standard calls with the MySQL2 Node.js package. In this post, we highlight the lines that relate to the query and multi-tenancy:
In this code, user refers to a MySQL user or tenant. The first line uses a SELECT statement to gather five random rows of data in the 1,000 for the relevant tenant in their database. The tenant id, database, and resource name sections extract the tenant_id parameter passed to the function. In this example, this is an integer between 0–199, inclusive. The three sections then extract the tenant ID and map it to the relevant database and resource to access. For example, if tenant 100 requested information, the code extracts the value 100, chooses database100, and dynamically creates an IAM session policy that allows that tenant to access only that database.
Testing the function by choosing the Test tab on the function page requires you to configure a Lambda test event. Leave the default for the template, specify a name for the event name, and copy the following for the event itself:
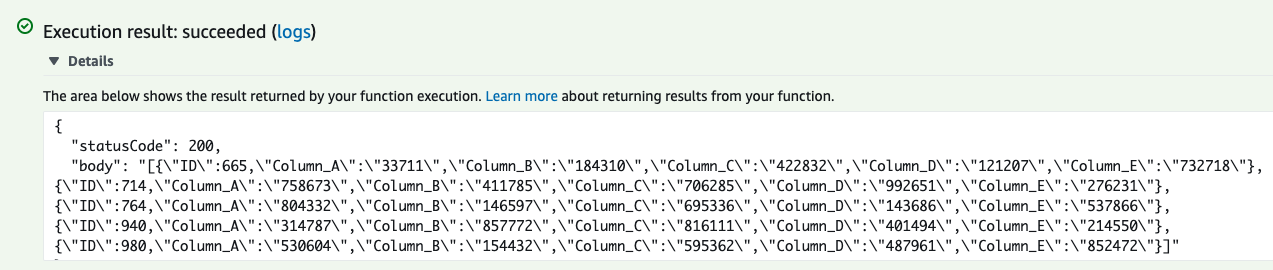
Choose Save Changes and then choose Test. The function should run successfully, and retrieve five random rows from the underlying database.
The preceding screenshot shows that five random rows have been selected with IDs between 1–1,000, with each row containing five random integer values in columns A–E. To see the tenant isolation boundaries in practice, go back to the Code tab and the index.js file, uncomment the lines beginning with // var dbUser, // var database, and // var resource, and comment the line immediately above each. Edit the number at the end of the now uncommented lines such that the tenant IDs aren’t matching. For example:
The code has been changed to have tenant 100 attempt to access the database belonging to tenant 101, with the permissions of tenant 100. Deploying and testing this function results in an execution failure, with the following error message:
Scrolling down into the logs shows the specific error that has led to this:
This therefore prohibits tenants from accessing data belonging to different tenants. You can experiment with other combinations of tenant IDs (between 0–199) to find that unless all three IDs match, access is denied for the tenant. Revert the code to its original form, as shown in the first code snippet, and choose Deploy before continuing with the next section.
Run the load test
So far, we have deployed the load stack and followed the instructions, specifying values for total number of users (bots), hatch rate, and host on the Locust dashboard. Choose Start swarming to begin the load test, and the number of users in the top bar should increase.
The tenant ID is passed at the end of the API requests made by Locust as a query string, which the Lambda function then uses to restrict and allow access to the database matching the tenant ID. During the load test, every several seconds, every Locust user takes a random tenant ID, picks between the Proxy and No Proxy VPCs at random, and calls the relevant API endpoint with the chosen tenant ID.
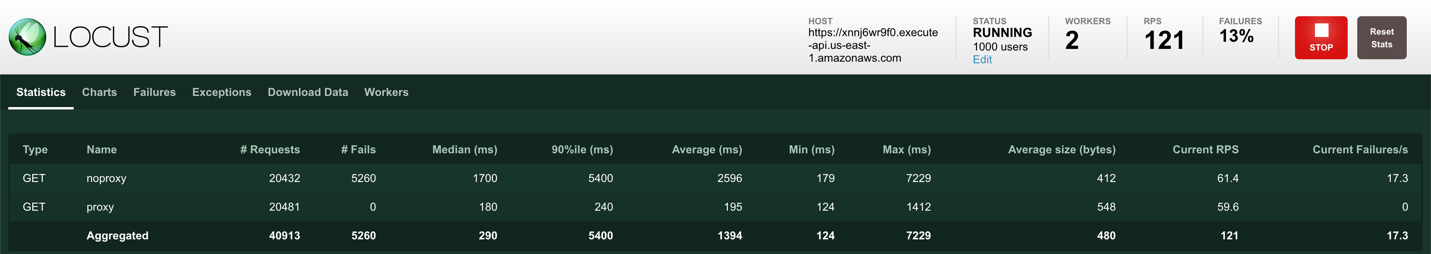
The number of requests should increase with both the Proxy and No Proxy endpoints to a similar number for each, because each has a 50% probability of being selected. In the top right corner of the following screenshot, you can observe the number of requests per second (RPS). Simulating 1,000 users will see this number reach around 120 (though this may vary), with a difference in errors between the two endpoints. These appear under the # Fails column on the dashboard.
You should also begin to see significant differences in response times, namely Median, 90%ile, and Average, all in milliseconds.
Analyze results
Navigating to the service map on the X-Ray console shows the results in more detail.
X-Ray traces user requests as they traverse through the architecture. The preceding screenshot shows higher errors and response times in the No Proxy VPC as opposed to the Proxy VPC. To see the errors in more detail, choose the circle corresponding to the API Gateway on the no_proxy_stage, select the check box corresponding to Fault on the right panel, and choose Analyze traces.
This shows you the response time distribution of the requests, time series activity, and further trace data. The page shows that all these faults are attributed to 500 HTTP status codes, the same as the modified Lambda function output seen in the previous section. Scrolling to the bottom of the page shows the trace list, which should look like the following screenshot.
These are the responses that are being returned to the client. You can view the Lambda CloudWatch logs to see the underlying error messages (choosing Monitor, and View logs in CloudWatch on the No Proxy Lambda console will show the log streams that contain these messages), and doing so reveals that for the No Proxy database, they are of the following form:
This shows that the errors accumulated are a result of authentication timeouts, causing access denied errors. The access denied errors are a symptom of using IAM authentication to connect to the database instance directly, because doing so consumes additional resources. The recommendation when using IAM authentication with MySQL is to have fewer than 200 new requests per second. As we can see for the Proxy VPC, these errors aren’t present. This is because although IAM authentication is used, it’s used between the Lambda function and RDS Proxy (with native authentication used between RDS Proxy and the database instance), rather than between the Lambda function and the database instance directly.
Although IAM authentication has its advantages, going over 200 new connections per second isn’t recommended in practice, because of the results for the No Proxy VPC that this test highlights. These errors aren’t present (however the advantages of IAM authentication would be lost) if you connect to the database instance using native authentication with a username and password, increasing the number of maximum connections to up to 16,000. This load test is designed to compare on an IAM authentication basis only and show the benefits of RDS Proxy with this. Testing using native authentication shows the No Proxy VPC much more favorably, which makes it the recommended approach for customers not needing IAM authentication.
On the CloudWatch console, choose Dashboards in the navigation pane, then locate LoadTestDashboard-{random string} (the precise name is on the Outputs tab on the CloudFormation console). This CloudWatch dashboard shows metrics for API Gateway, Lambda, Amazon RDS, and RDS Proxy, comparing the Proxy and No Proxy VPCs. The dashboard in the following screenshot was taken after load testing for 30 minutes with 1,000 users.
We encourage you to explore these metrics on your own and see for yourself the differences, but just to highlight a few (note that your results may vary):
The number of HTTP 500 responses is around 900 per minute for No Proxy, and zero for Proxy.
The CPU utilization for the Proxy Aurora replicas is around four times lower than for No Proxy.
The number of reader DB connections for Proxy remains consistent throughout, using the warm connection pool.
You should also see that the number of concurrent Lambda connections is much higher for the No Proxy VPC as it is for the Proxy VPC. This is because, although the request rate is the same, the latencies for the No Proxy database are greater, resulting in more functions waiting for a response from the database. If you see a value for Lambda Throttles above zero on your dashboard, consider either reducing the number of total users in Locust, or raising the default value for concurrent running Lambda functions. For more information, see Requesting a quota increase.
Additionally, you can compare the results on the database layer directly by using Performance Insights. To do this, navigate to the Amazon RDS console, choose Performance Insights in the navigation pane, and select the database instance identifiers corresponding to the Proxy and No Proxy databases (these can be found in the Outputs tab on the CloudFormation console under ProxyAuroraReplica and NoProxyAuroraReplica 1 and 2, respectively). Three useful metrics to compare here are Connections, Innodb_rows_read, and Queries, and these can be found by choosing Manage metrics. We will leave you to compare these results for yourself.
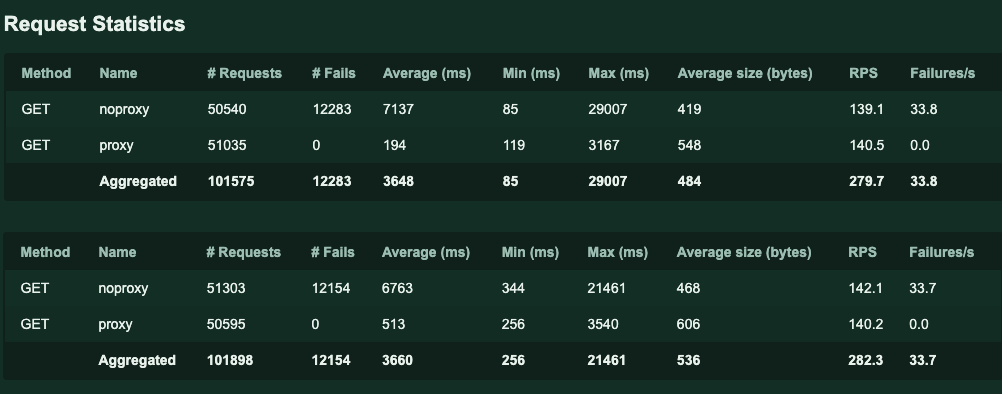
Different Lambda function runtimes can produce different results. This shows that there are steps in addition to using a proxy that can improve performance. Results also differ by changing the RPS, and this can be changed by modifying the number of users (bots). In addition to the results described earlier with 1,000 users, the following screenshot compares both Node.js (top) and Python (bottom) runtimes for 3,000 users.
You can create a similar report for your own load test by navigating to Download Data, then Download Report, on the Locust dashboard.
The benefits of RDS Proxy are clearly visible. Not only can it reduce integration latencies, it can reduce the number of errors and access denied requests that your tenants face. The overall conclusion from this is clear: using RDS Proxy can help to achieve tenant isolation at scale, without compromising on performance.
In production
The code provided in this post is for demonstrative purposes only, and should not be used in production. If you want to use these services in a production environment, take note of the following:
One RDS Proxy can be associated with a maximum of 200 Secrets Manger secrets. However, you can combine more than one RDS Proxy, either for the same or different underlying Aurora clusters, in order to increase the number of tenants.
There is a 29-second integration timeout limit for a REST API on API Gateway. In my testing, this was the reason for most of any visible Proxy VPC errors, because all the errors had a response time of 29.0 seconds (you can verify this yourself using X-Ray: repeat the process described earlier but this time for the Proxy VPC).
There are soft limits on the number of proxies per AWS account (20), the number of Lambda concurrent executions (1,000), and the number of requests per second on API Gateway (10,000), however all of these can be increased if necessary.
Pricing and cleanup
The load test should be stopped and the load test stack should be deleted immediately after testing, to avoid paying for idle resources. Running for a 30-minute load test of 150 RPS and then deleting the template immediately afterwards costs approximately $3.90; for 4 hours it costs approximately $31. Leaving all resources as is without deleting them for a whole month, without a load test, costs approximately $1,293. A detailed pricing breakdown on all three of these examples, specifying the costs of each component, can be found on the GitHub repository. Note that these are price estimates, and will vary depending on the AWS Region, duration and significance of the load test, whether only the Proxy VPC is deployed or the whole architecture, and several other factors.
To avoid incurring future charges, delete the stack. If you want to keep the Proxy VPC and resources within, you can choose to delete only the load test stack. You can do this by choosing Update on the main stack page, selecting Use current template, changing the parameter Create Load Test Stack to False, and redeploying. If you do this, the MySQL Aurora cluster will still contain the dummy data that was populated from the load test stack, so the databases will need to be dropped accordingly. The Secrets Manager secrets, however, are deleted. Deleting the entire template tears down the entire architecture.
Conclusion
This post showed you how to achieve database tenant isolation at scale, without compromising on performance with MySQL. It provided a Proxy VPC, and load tested it compared to a No Proxy VPC alternative. By reading and following along with this post, you have learned how to construct and test a multi-tenant, scalable database proxy solution, and gained further knowledge in the services and features that comprise the solution. For more information, refer to Using Amazon RDS Proxy with AWS Lambda, which was the inspiration for this post.
About the Author
Sam Sanders is a Solutions Architect at AWS, working with ISV customers across the UK in topics from multi-tenancy to machine learning. When not working with customers or writing content, he likes to play tennis and music.
Read MoreAWS Database Blog