

Database monitoring is the process of measuring and tracking database performance. The performance is measured by analyzing certain key metrics at the Database level and Operating System level. Effective database monitoring and timely alerting also gives you an opportunity to enhance or optimize your database, to augment overall performance and minimize downtime.
AWS provides multiple tools, techniques and metrics to monitor and alarm on, giving you a view over what is going on in the Amazon Relational Database Service (Amazon RDS) for SQL Server and how to optimize the operation and performance of RDS for SQL Server Instance. As there are multiple tools and metrics available, it becomes difficult for the user to decide on what to enable and monitor. This becomes more challenging when you have multiple instances to monitor. To address this challenge, an application owner must identify a list of key metrics and automate the monitoring tasks to be notified when these metrics breach an acceptable threshold.
In this series we highlight the key metrics and events that you might want to subscribe to for monitoring RDS for SQL Server databases. We also provide step by step configuration to setup alerts once these key metrics hit the threshold.
We divided this series in two parts:
In the first part we present an overview of the database monitoring tools provided by AWS, Important Metrics to analyze and alert on when the metrics breach baseline threshold and Important Events to subscribe to.
In the second post, we provide a step-by-step configuration of CloudWatch Alarms and SNS Topics to receive notifications.
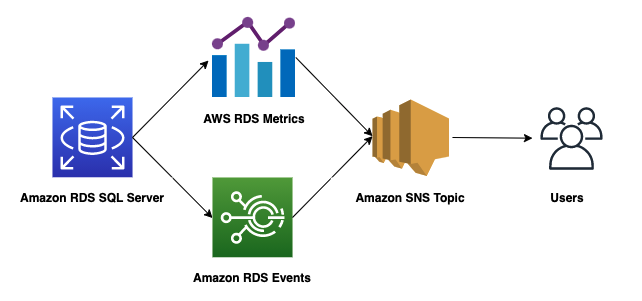
Flow of events and metrics from RDS for SQL Server to users through SNS topics
Overview of Database Monitoring Tools, Database Metrics and Events
A.1 Monitoring Tools Provided by AWS
AWS provides various tools to monitor an Amazon RDS instance, as listed in the following section.
A.1.1 Amazon RDS Events
Amazon RDS uses the Amazon Simple Notification Service (Amazon SNS) to provide notification when an Amazon RDS event occurs. These notifications can be in any notification form which is supported by Amazon SNS for an AWS Region, such as an email, a text message, or a call to an HTTP endpoint. Amazon RDS organizes these events into categories that you can subscribe to so that you can be notified when an event in that category occurs. You can subscribe to an event category for a DB instance, DB snapshot, DB parameter group, or DB security group. For example, if you subscribe to the Backup category for a given DB instance, you are notified whenever a backup-related event occurs that affects the DB instance. Similarly, if you subscribe to a configuration change category for a DB security group, you are notified when the DB security group is changed.
A.1.2 RDS for SQL Server Error Log Files
You can view, download, and watch RDS for SQL Server error logs, agent log files by using the AWS Management Console or the Amazon RDS API.
A.1.3 CloudWatch Monitoring
Amazon CloudWatch automatically collects near real-time metrics from Amazon RDS, in the form of logs, metrics, and events, and allows you to visualizes them using automated dashboards. As of now, by default Amazon RDS automatically sends metric data to CloudWatch in 1-minute periods, which are available for 15 days. This means that you can access historical information in CloudWatch and see how your database application is performing. The key metrics that are useful for monitoring the database instance are described in section A.2.
A.1.4 Enhanced Monitoring
To make the most of your monitoring, we recommend that you enable Enhanced Monitoring when creating the database instance. By default, only metrics gathered by the hypervisor are sent to CloudWatch, whereas Enhanced Monitoring collects metrics using an agent on the instance. As a best practice, we recommend using 5 seconds granularity for collecting Enhanced Monitoring metrics. As of now, Enhanced Monitoring metrics are stored for default retention of 30 days in the CloudWatch Logs. This retention period is different from typical CloudWatch metrics. For instance, Enhanced Monitoring metrics are useful to see how different processes or threads use the CPU. The cost of Enhanced Monitoring depends on various factors. For more information, see Cost of Enhanced Monitoring.
A.1.5 Performance Insights
Performance Insights expands on existing Amazon RDS monitoring features to visualize your database’s performance and proactively analyze any issues that might impact the DB instance. If you have more than one database on a DB instance, Performance Insights aggregates performance data. With the Performance Insights dashboard, you can visualize the database load and filter the load by:
Waits
SQL Statements
Hosts
Users
A.2. Key CloudWatch Metrics
We recommend monitoring the following list of key CloudWatch metrics and alert on them when the metrics breach baseline threshold.
A.2.1 CPU Utilization
CPU utilization is the percentage of processing power being utilized by the operation on the RDS Instance. As per best practices and standards, continuous CPU Utilization above 80% suggests that the instance is CPU constraint. At this point users may look into Performance Insights and want to tune queries using maximum CPU. If the CPU Utilization continues to remain high even after queries are tuned, it may be an indication to increase the CPU power of the RDS Instance. Alternatively, if the CPU Utilization is consistently below 20%, users may think about reducing the compute capacity of the RDS instance by scaling-down the instance type to reduce cost.
Sample threshold: The sample CloudFormation template provided in our next post sets an alarm for the subscriber to be notified when CPU utilization is consistently above 80%.
A.2.2 Memory Utilization (Freeable Memory)
Freeable memory is the amount of memory (RAM) available on the RDS Instance. The value of Freeable memory should never go too low. The optimal value completely depends on the database type (OLTP/OLAP), application or system type that is being used. As a reference, if RDS instance memory consumption frequently crosses below 2048 MB, then this indicates that you should check your workload or scale up your instance to cater to the memory demand. Value of 2048 MB is for reference. Please choose value based on your application and database type and usage.
Enhanced Monitoring helps you to identify a specific thread ID that is consuming high amounts of memory. The thread ID is what SQL Server refers to as the Kernel process ID (KPID).
Sample threshold: The sample CloudFormation template provided sets an alarm for the subscriber to be notified when Freeable Memory consistently drops below 2 GB i.e., 2048 MB.
A.2.3 I/O Operations (Read/Write latency)
Read latency is the amount of time taken to read a request from the disk whereas write latency is the amount of time taken to write the request to the disk. As per the best practices, following are the values of read/write latencies:
Excellent: < 1ms
Very good: < 5ms
Good: 5 – 10ms
Poor: 10 – 20ms
Bad: 20 – 100ms
If the read or write latency consistently stays above 20ms, users may consider upgrading their Storage Type.
If the workload, is I/O constrained, using Provisioned IOPS SSD storage can increase the number of I/O requests that the system can process concurrently. Increased concurrency allows for decreased latency because I/O requests spend less time in a queue. Decreased latency allows for faster database commits, which improves response time and allows for higher database throughput.
Sample threshold: The sample CloudFormation template provided sets an alarm for the subscriber to be notified when Read/Write Latency is consistently above 20ms.
A.3 Important RDS for SQL Server Events
As per best practice, we recommend subscribing to the following RDS for SQL Server events so that the users/teams are notified to take appropriate action and avoid any impact to the database instance.
Availability
Configuration Change
Deletion
Failover
Failure
Low Storage
Maintenance
Visit the RDS User Guide for more information about RDS event notification.
Conclusion
In this post, I discussed various AWS Monitoring tools, important Amazon RDS for SQL Server events and key CloudWatch metrics. In our next post, we walk through step-by-step configuration of CloudWatch Alarms and SNS Topics to receive notifications. Leave a comment if you have questions or feedback.
About the Author
Vikash Singh is a Database Consultant with the Professional Services team at Amazon Web Services. He works as a database migration consultant to provide Amazon customers with technical guidance to migrate their on-premises databases to AWS.
Read MoreAWS Database Blog