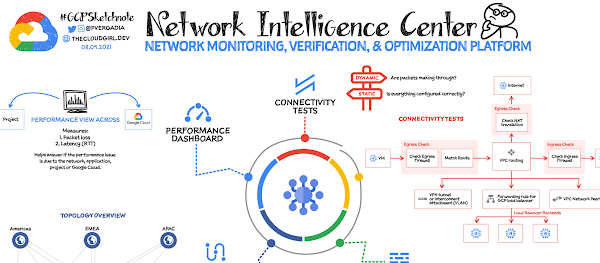
You need visibility into your cloud platform in order to monitor and troubleshoot it. Network Intelligence Center provides a single console for Google Cloud network observability, monitoring, and troubleshooting. Currently Network Intelligence Center has four modules:
Network Topology: Helps you visualize the network topology including VPC connectivity to on-premises, internet, and their associated metrics. Connectivity Tests: Provides both static and dynamic network connectivity tests for configuration and data-plane reachability, to verify that packets are actually getting through.Performance Dashboard: Shows packet loss and latency between zones and regions that you are using. Firewall Insights: Shows usage for your VPC firewall rules and enables you to optimize their configuration
Network Topology
Network Topology collects real-time telemetry and configuration data from Google infrastructure and uses it to help you visualize your resources. It captures elements such as configuration information, metrics, and logs to infer relationships between resources in a project or across multiple projects. After collecting each element, Network Topology combines them to generate a graph that represents your deployment. This enables you to quickly view the topology and analyze the performance of your deployment without configuring any agents, sorting through multiple logs, or using third-party tools.
Connectivity Tests
The Connectivity Tests diagnostics tool lets you check connectivity between endpoints in your network. It analyzes your configuration and in some cases performs run-time verification.
To analyze network configurations, Connectivity Tests simulates the expected inbound and outbound forwarding path of a packet to and from your Virtual Private Cloud (VPC) network, Cloud VPN tunnels, or VLAN attachments.
For some connectivity scenarios, Connectivity Tests also performs run-time verification where it sends packets over the data plane to validate connectivity and provides baseline diagnostics of latency and packet loss.
Performance Dashboard
Performance Dashboard gives you visibility into the network performance of the entire Google Cloud network, as well as the performance of your project’s resources. It collects and shows packet loss and latency metrics. With these performance-monitoring capabilities, you can distinguish between a problem in your application and a problem in the underlying Google Cloud network. You can also debug historical network performance problems.
Firewall Insights
Firewall Insights enables you to better understand and safely optimize your firewall configurations. It provides reports that contain information about firewall usage and the impact of various firewall rules on your VPC network.
For a more in-depth look into Network Intelligence Center check out the documentation.
For more #GCPSketchnote, follow the GitHub repo. For similar cloud content follow me on Twitter @pvergadia and keep an eye out on thecloudgirl.dev
Cloud BlogRead More


