TL;DR: You can visualize your billing data with Looker to gain insights on your spending over time! Use the Google Cloud Cost Management block to quickly get analyzing.
Along with the growth of the power and flexibility of the cloud, there’s also an increasing need for better visibility into your cloud spend. If you’re just getting started or aren’t running much in the cloud, the billing reports are a great place to start and can help you see what you’re paying for. However, as your usage of the cloud grows, you may need even more details on where that spend came from. As a best practice, we always recommend enabling the export of your billing data to BigQuery. This should be your first step when creating a new billing account because you can’t backfill any data before enabling the export and you’ll probably want all the data you can get!
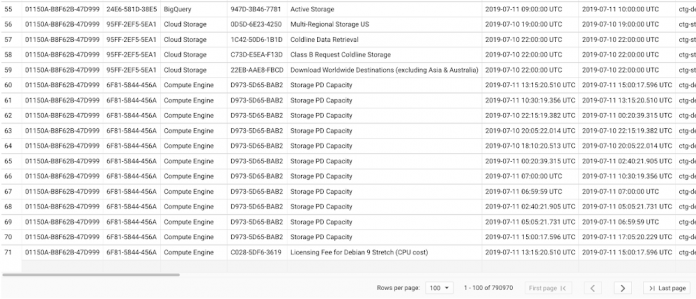
That’s a lot of data!
The standard billing export includes both a cost table, where you can see cost and usage across services, and a pricing table, that can be used to analyze prices, discounts and services. Besides the standard billing export, you can also use the preview feature to export insights and recommendations data into BigQuery. Recommender is a service that provides per-product or per-service recommendations, and are generated based on heuristic methods, machine learning, and current resource usage.
With these exports enabled, you can use BigQuery to analyze spend details down to the hour, but maybe you’re not the kind of person who enjoys writing queries or puzzling through data from hundreds of thousands of rows (or maybe you are, no judgement). So where do you go from here? Enter visualization!
Look, it’s Looker!
Looker is a business intelligence/big data analytics platform that helps you explore and analyze your data, and we’ve just recently launched the Google Cloud Billing block to help you get started on your visualization journey. Using the Looker Marketplace, you can easily install any number of Looker Blocks and other content to help you get a running start. Installing the Google Cloud Billing block only takes a few steps and you’ll end up with a dashboard to help you see what your spend looks like.
That’s also a lot of data, but much easier to understand!
To get started using the GCP Billing block, you’ll need to first create a connection to your BigQuery project using the steps outlined here. Next, you can search through the marketplace to find and install the block on your instance.The pre-built Looker is a great starting place for analyzing your billing data. However, you can continue to develop new fields in LookML or even customize existing definitions. We’ve included some examples of how to customize this block in our Github ReadMe here.
Using the dashboards
Now that you have your shiny new dashboards up and running, there’s a few things you may want to look for to optimize your spend. First off, you may want to use the Cost Summary Dashboard to pinpoint areas of high spend to drill into.
Using the Project Deep Dive dashboard we can focus our attention on a single project that has unusual spend behavior. With the information in this report, we can pinpoint a specific service that is ripe for optimization – for example, Compute Engine.
Finally, we can head over to the Recommendations Insights dashboard to understand where there may be tactical things we can do to immediately reduce costs. You can even create a custom field-action to mark a recommendation as accepted straight from the Looker dashboard.
Further customizations
One of the key advantages of centralizing your billing, pricing and recommendations data into BigQuery and analyzing it in Looker is the ability to include custom business logic and other data sources.
For example, you may use labels to represent the designated cost center for each project. In this case, you can customize the LookML to create a new dimension that leverages the value from the cost_center, as shown here. With each cost center represented in your model, you could even refine the aggregation metrics to divide up the support costs across each team. Finally, each one of these centers may have their own budget information, that’s managed in a Google Spreadsheet. By creating an external table in BigQuery, Looker users can now see how each team’s spend is tracking towards their budget.
With so many organizations taking a mult-cloud approach to their technology stack, you may be wondering how you can see your Google Cloud billing data alongside other platforms. The good news is that the Google Cloud Cost Management block is just one element of the Looker Multi-Cloud Cost Management Solution – stay tuned for more on that soon!
See what I mean?
While you may want to do some additional customizations, the block is a great starting point to quickly see where your spend is coming from and if there are any surprises. Another option to get started is using the Data Studio template that gives you a few starting views into your billing data.
The starter Data Studio template with some sample billing data
If you’re not using Looker yet, check out these getting started guides to help you learn more and request a demo.
Cloud BlogRead More


