

BigQuery Reservations help manage your BigQuery workloads. With flat-rate pricing, you can purchase BigQuery slot commitments in 100-slot increments in either flex, monthly, or yearly plans instead of paying for queries on demand. You can then create/manage buckets of slots called reservations and assign projects, folders, or organizations to use the slots in these reservations. By default, queries running in a reservation automatically use idle slots from other reservations. In this way, organizations have greater control over workload management in a way that ensures high-priority jobs always have access to the resources they need without contention. Currently, two ways to monitor these reservations and slots are via the BigQuery Reservations UI or Cloud Monitoring.
But how does an organization know how many slots to delegate to a reservation? Or if a reservation is being over or underutilized? Or what the overall slot utilization is across all reservations? In this blog post, we will discuss how we used BigQuery’s INFORMATION_SCHEMA system tables to create the System Tables Reports Dashboard and answer these questions.
Using INFORMATION_SCHEMA tables
The INFORMATION_SCHEMA metadata tables contain relevant, granular information about jobs, reservations, capacity commitments, and assignments. Using the data from these tables, users can create custom dashboards to report on the metrics they are interested in in ways that inform their decision making.
While there are several tables that make up INFORMATION_SCHEMA, there are a few that are specifically relevant to monitoring slot utilization across jobs and reservations. The JOBS_BY_ORGANIZATION table is the primary table to extract job-level data across all projects in the organization. This information can be supplemented with data from the CAPACITY_COMMITMENT_CHANGES_BY_PROJECT, RESERVATION_CHANGES_BY_PROJECT, and ASSIGNMENT_CHANGES_BY_PROJECT tables to include details about specific capacity commitments, reservations, and assignments. It’s worth noting that the data retention period for INFORMATION_SCHEMA is 180 days and all timestamps are in UTC. For information about the permissions required to query these tables, follow the links above.
Monitoring with the System Tables Reports Dashboard
The System Tables Reports Dashboard is a Data Studio dashboard that queries data from INFORMATION_SCHEMA by using Data Studio’s BigQuery connector. Organizations can use this dashboard and/or its underlying queries as-is or as a starting point for more complex solutions in Data Studio or any other dashboarding tools.
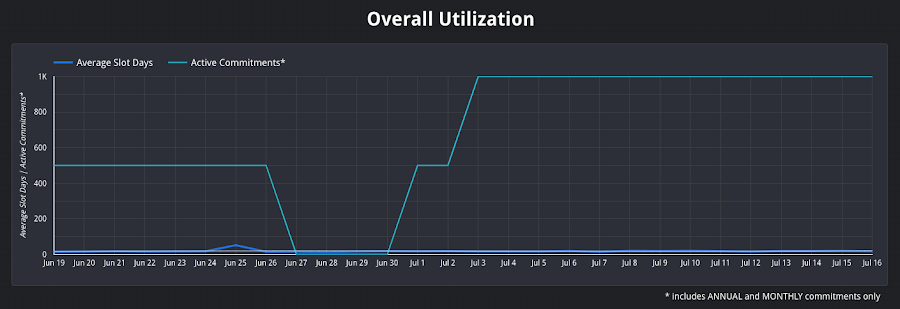
The Daily Utilization Report gives an overview of an organization’s daily slot utilization measured in slot days. The primary chart in the report is for overall slot utilization per day alongside the active capacity commitments for the organization. This chart is ideal for gaining a high-level understanding of how an organization’s usage compares to the total number of slots it has committed to (or purchased).
The query used to derive the average slot utilization is as follows:
Slot utilization is derived by dividing the total number of slot-milliseconds (total_slot_ms from INFORMATION_SCHEMA.JOBS_BY_ORGANIZATION) consumed by all jobs on a given day by the number of milliseconds in a day (1000 * 60 * 60 * 24). This aggregate-level computation provides the most accurate approximation of the overall slot utilization for a given day. Note that this calculation is most accurate for organizations with consistent daily slot usage. If an organization does not have consistent slot usage this number might be lower than expected. For more information about calculating average slot utilization, see our public documentation.
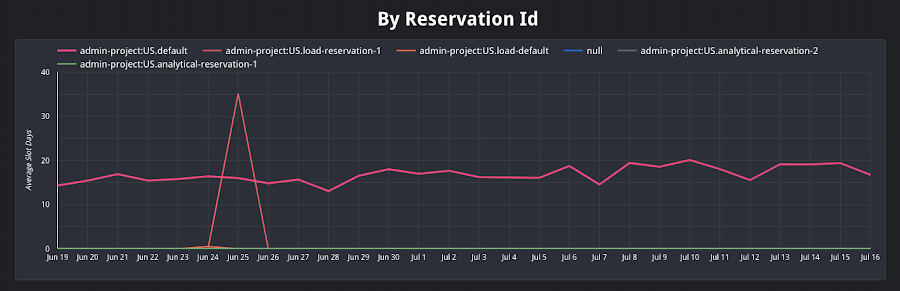
This report also includes charts that break down the utilization further by job type, project id, reservation id (shown below), user email, and top usage.
The Hourly Utilization Report is similar to the daily utilization report but gives an overview of an organization’s hourly slot utilization measured in slot hours. This report can help an organization understand their workloads at a more granular level in a way that helps with workload management.
Reservation Utilization Report
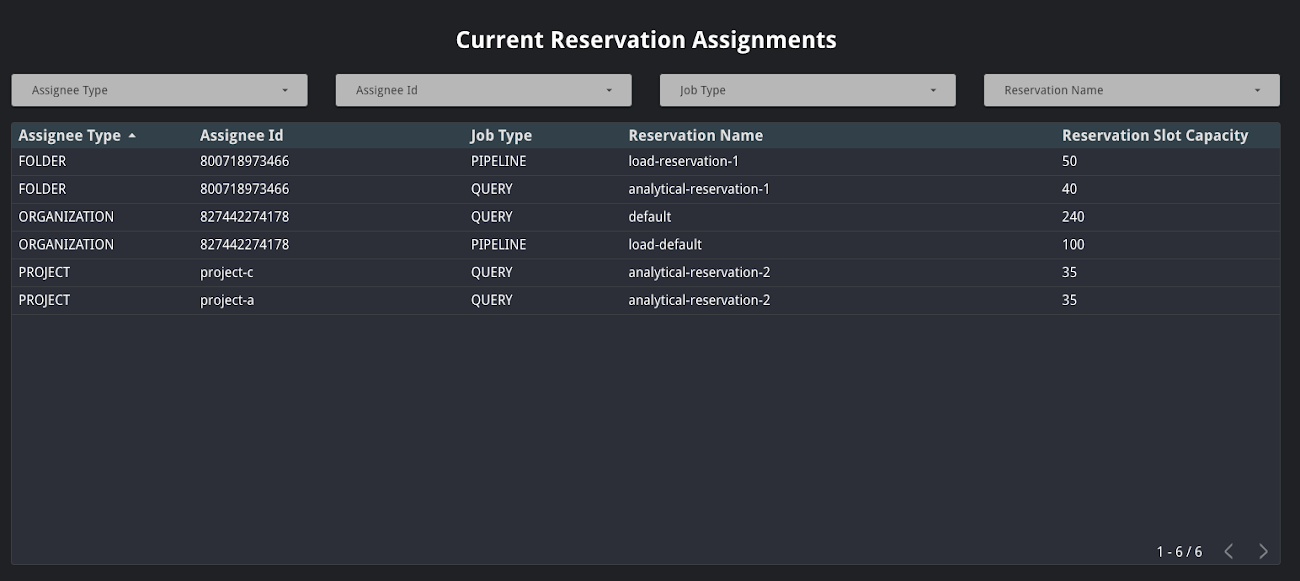
The Reservation Utilization Report gives an overview of an organization’s current assignments and reservation utilization in the last 7 and 30 days.
The current reservation assignments table displays details for the current assignments across an organization including the assignment type, job type and reservation capacity.
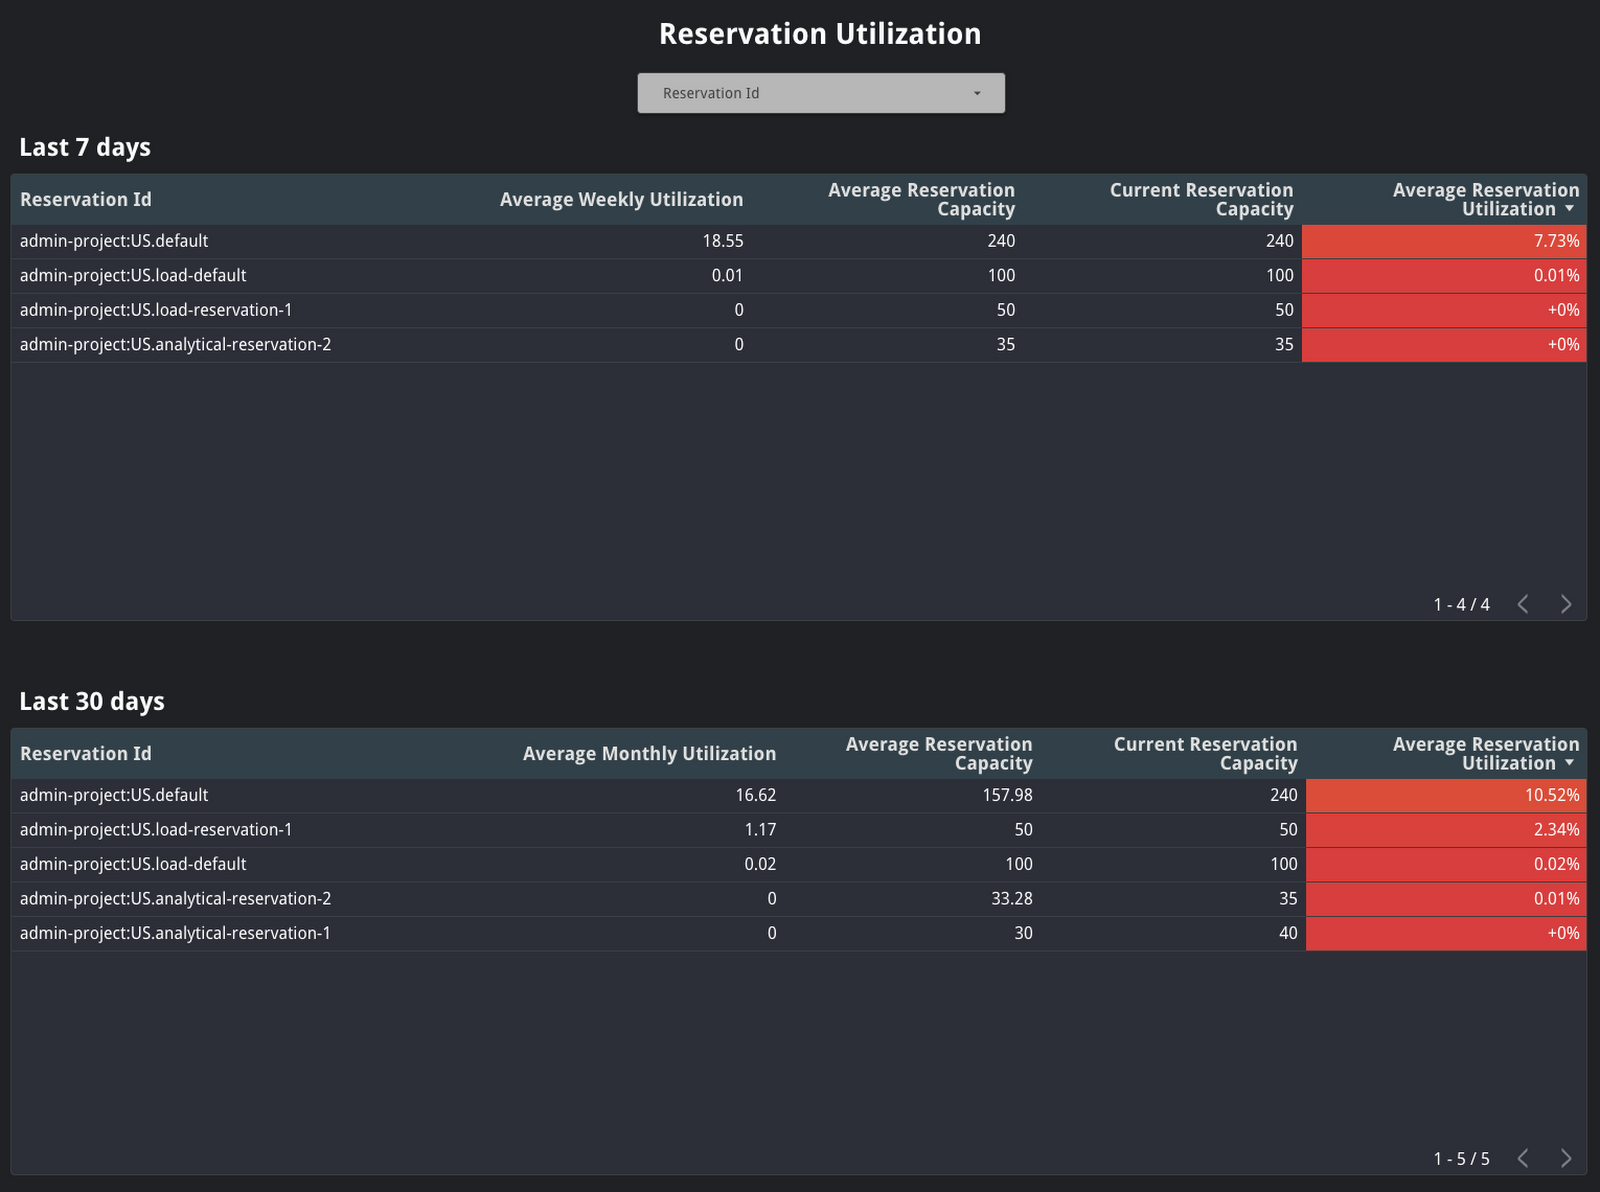
The reservation utilization tables display information about the utilization of a given reservation in the last 7 or 30 days. This includes average weekly or monthly slot utilization, average reservation capacity, current reservation capacity, and average reservation utilization. Average weekly and monthly utilization is derived using the same calculation as daily utilization, but adjusted for a week or month accordingly.
These tables are great for understanding if an organization is making the most of its allocated reservations. Reservations that are severely over or under utilized are colored in red, while reservations that are close to 100% utilization are colored in green. That said, because idle slot capacity is shared across reservations by default, underutilized reservations do not necessarily indicate that slots are being wasted. Instead, the jobs in that reservation simply do not need as many slots reserved and those slots could be allocated to a different reservation.
The Job Execution Report provides a per-job breakdown of slot utilization, among other job statistics. The purpose of this report is to allow users to drill down into individual jobs or understand trends in a specific group of jobs.
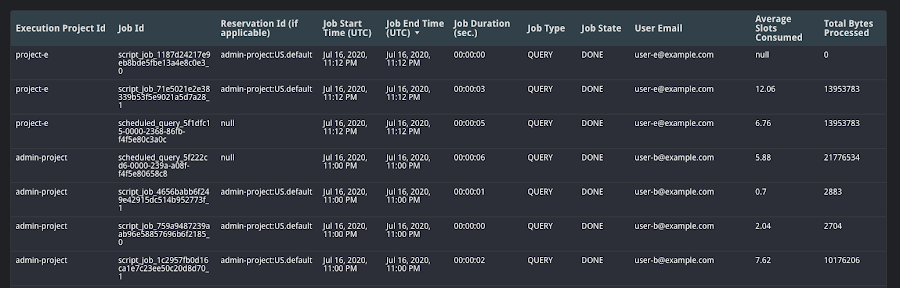
In this report, the average slot utilization is displayed on a per-job level instead of an aggregate level. This is calculated by dividing total_slot_ms for that job by the job’s duration in milliseconds (this can be computed by subtracting creation_time from end_time) as seen in the following query.
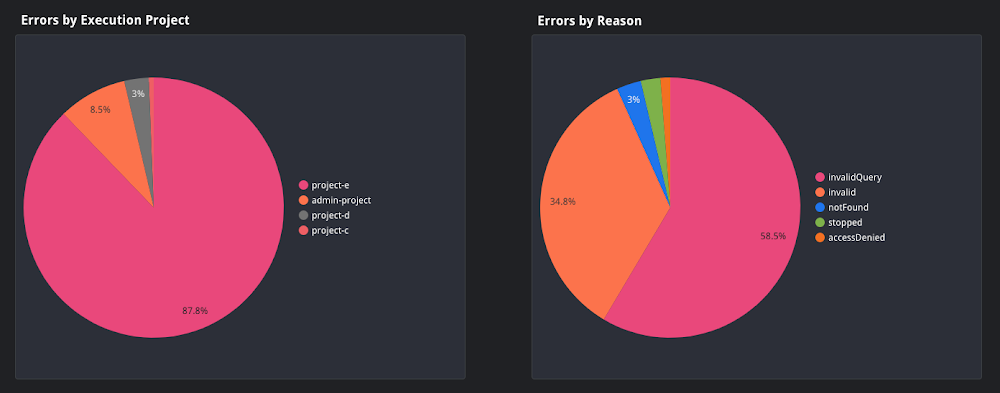
The Job Error Report provides an overview of the types of errors encountered by jobs in the organization aggregated by project and error reason, among other fields. The INFORMATION_SCHEMA tables provide detailed information about job-level errors, so depending on an organization’s use case this report can be customized with more specific error reporting information.
What’s next?
To learn more about INFORMATION_SCHEMA and the System Tables Reports Dashboard, check out the videos in our Modernizing Data Lakes and Data Warehouses with GCP course on Coursera. For more detailed information about each report, the queries used, and how to copy the dashboard for your own organization, visit our Github Repository.
Cloud BlogRead More