

Chatbots are increasingly becoming an important channel for companies to interact with their customers, employees, and partners. Amazon Lex allows you to build conversational interfaces into any application using voice and text. Amazon Lex V2 console and APIs make it easier to build, deploy, and manage bots so that you can expedite building virtual agents, conversational IVR systems, self-service chatbots, or informational bots. Designing a bot and deploying it in production is only the beginning of the journey. You want to analyze the bot’s performance over time to gather insights that can help you adapt the bot to your customers’ needs. A deeper understanding of key metrics such as trending topics, top utterances, missed utterances, conversation flow patterns, and customer sentiment help you enhance your bot to better engage with customers and improve their overall satisfaction. It then becomes crucial to have a conversational analytics dashboard to gain these insights from a single place.
In this post, we look at deploying an analytics dashboard solution for your Amazon Lex bot. The solution uses your Amazon Lex bot conversation logs to automatically generate metrics and visualizations. It creates an Amazon CloudWatch dashboard where you can track your chatbot performance, trends, and engagement insights.
Solution overview
The Amazon Lex V2 Analytics Dashboard Solution helps you monitor and visualize the performance and operational metrics of your Amazon Lex chatbot. You can use it to continuously analyze and improve the experience of end users interacting with your chatbot.
The solution includes the following features:
A common view of valuable chatbot insights, such as:
User and session activity (sentiment analysis, top-N sessions, text/speech modality)
Conversation statistics and aggregations (average session duration, messages per session, session heatmaps)
Conversation flow, trends, and history (intent path chart, intent per hour heatmaps)
Utterance history and performance (missed utterances, top-N utterances)
Slot and session attributes most frequently used values
Rich visualizations and widgets such as metrics charts, top-N lists, heatmaps, and utterance management
Serverless architecture using pay-per-use managed services that scale transparently
CloudWatch metrics that you can use to configure CloudWatch alarms
Architecture
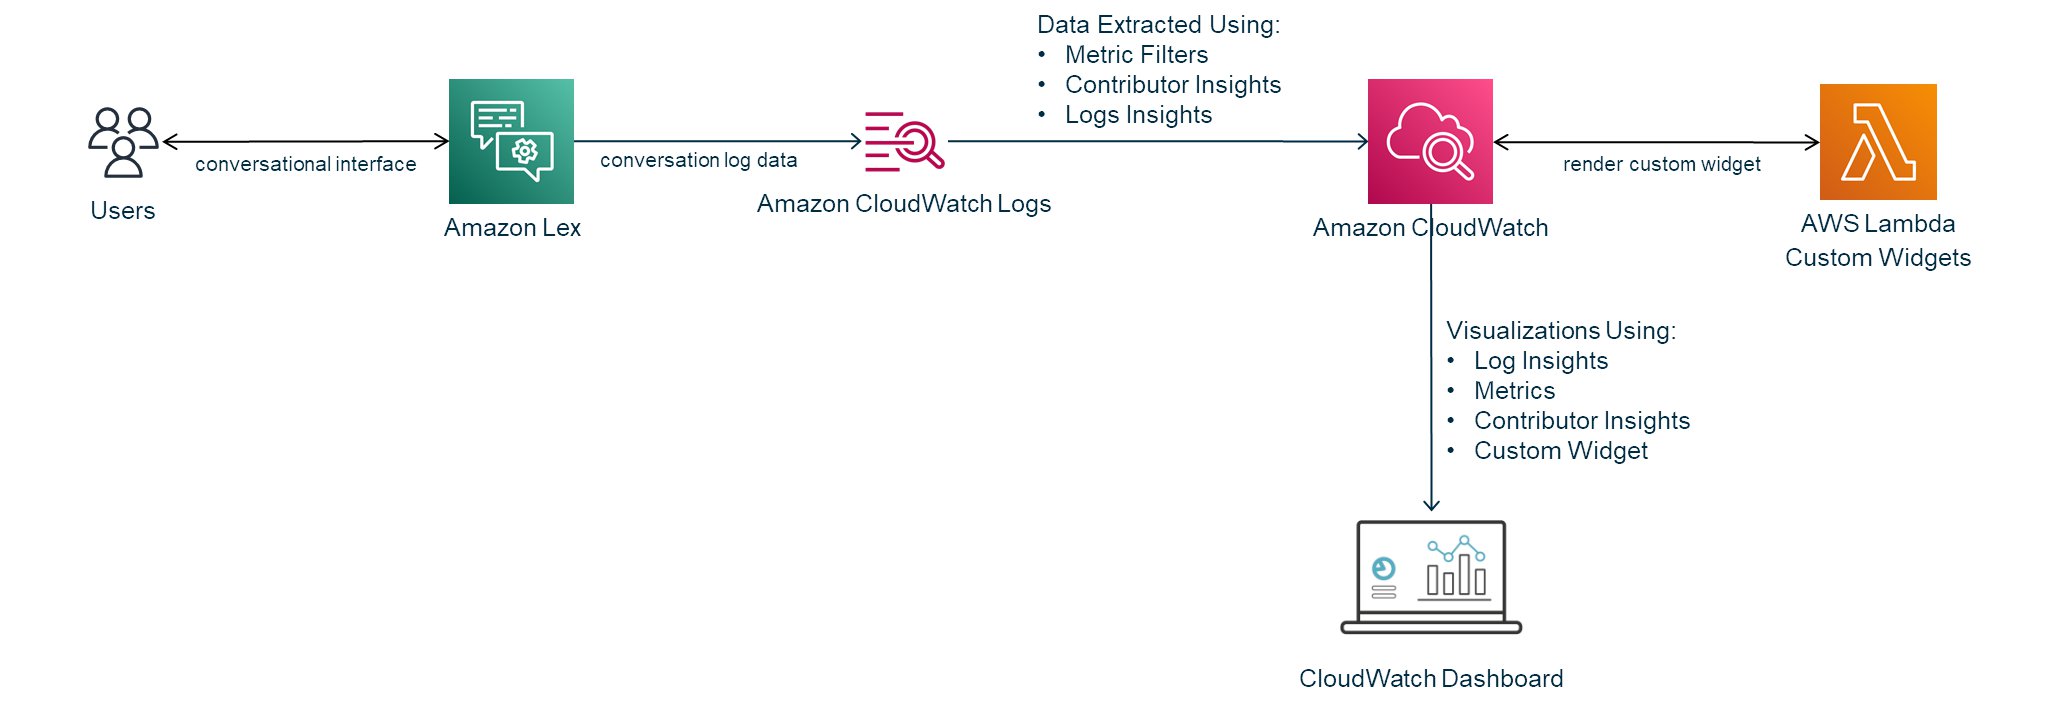
The solution uses the following AWS services and features:
Amazon Lex V2 conversation logs, which generate metrics and visualizations from interactions with your chatbot
Amazon CloudWatch Logs to store your chatbot conversation logs in JSON format
CloudWatch metric filters to create custom metrics from conversation logs
CloudWatch Logs Insights to query the conversation logs and create powerful aggregations from the log data
CloudWatch Contributor Insights to identify top contributors and outliers in highly variable data such as sessions and utterances
A CloudWatch dashboard to put together a set of charts and visualizations representing the metrics and data insights from your chatbot conversations
CloudWatch custom widgets to create custom visualizations like heatmaps and conversation flows using AWS Lambda functions
The following diagram illustrates the solution architecture.
The source code of this solution is available in the GitHub repository.
Additional resources
There are several blog posts for Amazon Lex that also explore monitoring and analytics dashboards:
Building a business intelligence dashboard for your Amazon Lex bots
Analyzing and optimizing Amazon Lex conversations using Dashbot
Analyzing Amazon Lex conversation log data with Amazon CloudWatch Insights
Building a real-time conversational analytics platform for Amazon Lex bots
Analyzing Amazon Lex conversation log data with Grafana
This post was inspired by the concepts in those previous posts, but the current solution has been updated to work with Amazon Lex bots created from the V2 APIs. It also adds new capabilities such as CloudWatch custom widgets.
Enable conversation logs
Before you deploy the solution for your existing Amazon Lex bot (created using the V2 APIs), you should enable conversation logs. If your bot already has conversation logs enabled, you can skip this step.
We also provide the option to deploy the solution with an accompanying bot that has conversation logs enabled and a scheduled Lambda function to generate conversation logs. This is an alternative if you just want to test drive this solution without using an existing bot or configuring conversation logs yourself.
We first create a log group.
On the CloudWatch console, in the navigation pane, choose Log groups.
Choose Actions, then choose Create log group.
Enter a name for the log group, then choose Create log group.
Now we can enable the conversation logs.
On the Amazon Lex V2 console, from the list, choose your bot.
On the left menu, choose Aliases.
In the list of aliases, choose the alias for which you want to configure conversation logs.
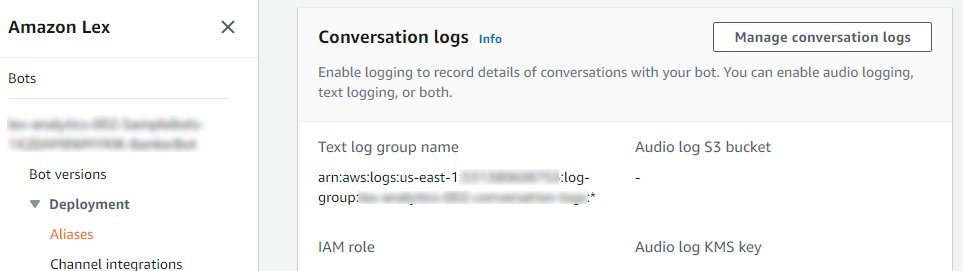
In the Conversation logs section, choose Manage conversation logs.
For text logs, choose Enable.
Enter the CloudWatch log group name that you created.
Choose Save to start logging conversations.
If necessary, Amazon Lex updates your service role with permissions to access the log group.
The following screenshot shows the resulting conversation log configuration on the Amazon Lex console.
Deploy the solution
You can easily install this solution in your AWS accounts by launching it from the AWS Serverless Application Repository. As a minimum, you provide your bot ID, bot locale ID, and the conversation log group name when you deploy the dashboard. To deploy the solution, complete the following steps:
You’re redirected to the create application page on the Lambda console (this is a Serverless solution!).
Scroll down to the Application Settings section and enter the parameters to point the dashboard to your existing bot:
BotId – The ID of an existing Amazon Lex V2 bot that is going to be used with this dashboard. To get the ID of your bot, find your bot on the Amazon Lex console and look for the ID in the Bot details section.
BotLocaleId – The bot locale ID associated to the bot ID with this dashboard, which defaults to en_US. To get the locales configured for your bot, choose View languages on the same page where you found the bot ID.Each dashboard creates metrics for a specific locale ID of a Lex bot. For more details on supported languages, see Supported languages and locales.
LexConversationLogGroupName – The name of an existing CloudWatch log group containing the Amazon Lex conversation logs. The bot ID and locale must be configured to use this log group for its conversation logs.
Alternatively, if you just want to test drive the dashboard, this solution can deploy a fully functional sample bot. The sample bot comes with a Lambda function that is invoked every 2 minutes to generate conversation traffic. If you want to deploy the dashboard with the sample bot instead of using an existing bot, set the ShouldDeploySampleBots parameter to true. This is a quick and easy way to test the solution.
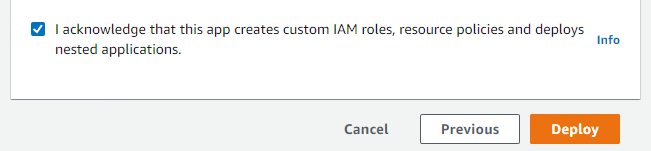
After you set the desired values in the Application settings section, scroll down to the bottom of the page and select I acknowledge that this app creates custom IAM roles, resource policies and deploys nested applications.
Choose Deploy to create the dashboard.
You’re redirected to the application overview page (it may take a moment).
Choose the Deployments tab to watch the deployment status.
Choose View stack events to go to the AWS CloudFormation console to see the deployment details.
The stack may take around 5 minutes to create. Wait until the stack status is CREATE_COMPLETE.
When the stack creation is complete, you can look for a direct link to your dashboard on the Outputs tab of the stack (the DashboardConsoleLink output variable).
You may need to wait a few minutes for data to be reflected in the dashboard.
Use the solution
The dashboard provides a single pane of glass that allows you to monitor the performance of your Amazon Lex bot. The solution is built using CloudWatch features that are intended for monitoring and operational management purposes.
The dashboard displays widgets showing bot activity over a selectable time range. You can use the widgets to visualize trends, confirm that your bot is performing as expected, and optimize your bot configuration. For general information about using CloudWatch dashboards, see Using Amazon CloudWatch dashboards.
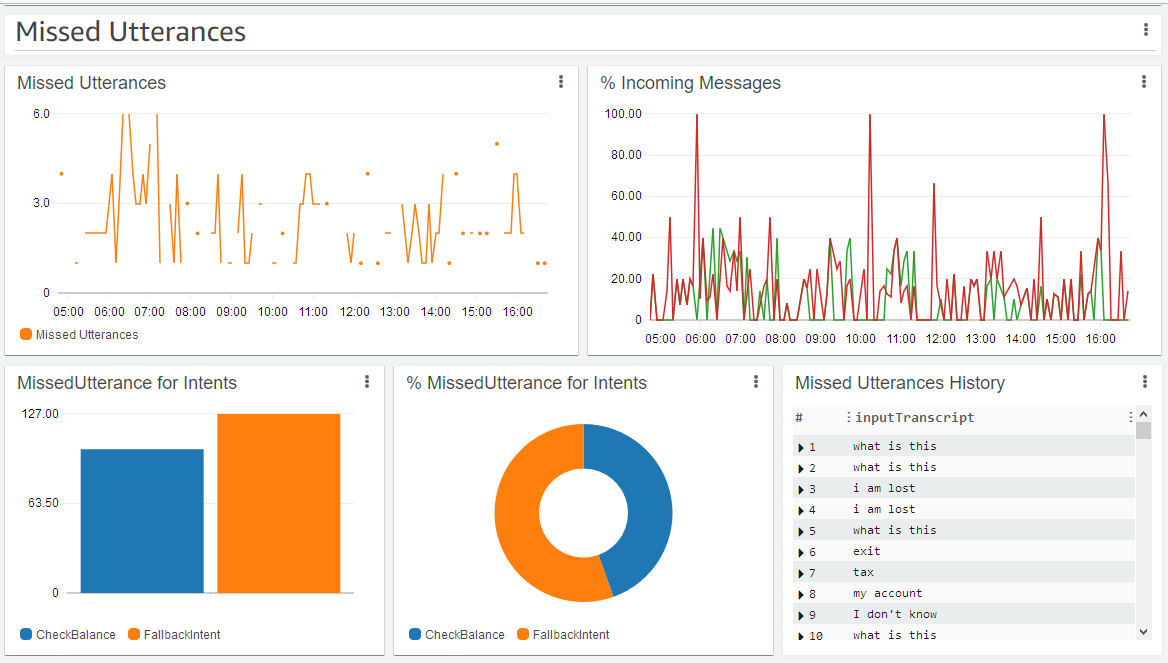
The dashboard contains widgets with metrics about end user interactions with your bot covering statistics of sessions, messages, sentiment, and intents. These statistics are useful to monitor activity and identify engagement trends. Your bot must have sentiment analysis enabled if you want to see sentiment metrics.
Additionally, the dashboard contains metrics for missed utterances (phrases that didn’t match the configured intents or slot values). You can expand entries in the Missed Utterance History widget to look for details of the state of the bot at the point of the missed utterance so that you can fine-tune your bot configuration. For example, you can look at the session attributes, context, and session ID of a missed utterance to better understand the related application state.
You can use the dashboard to monitor session duration, messages per session, and top session contributors.
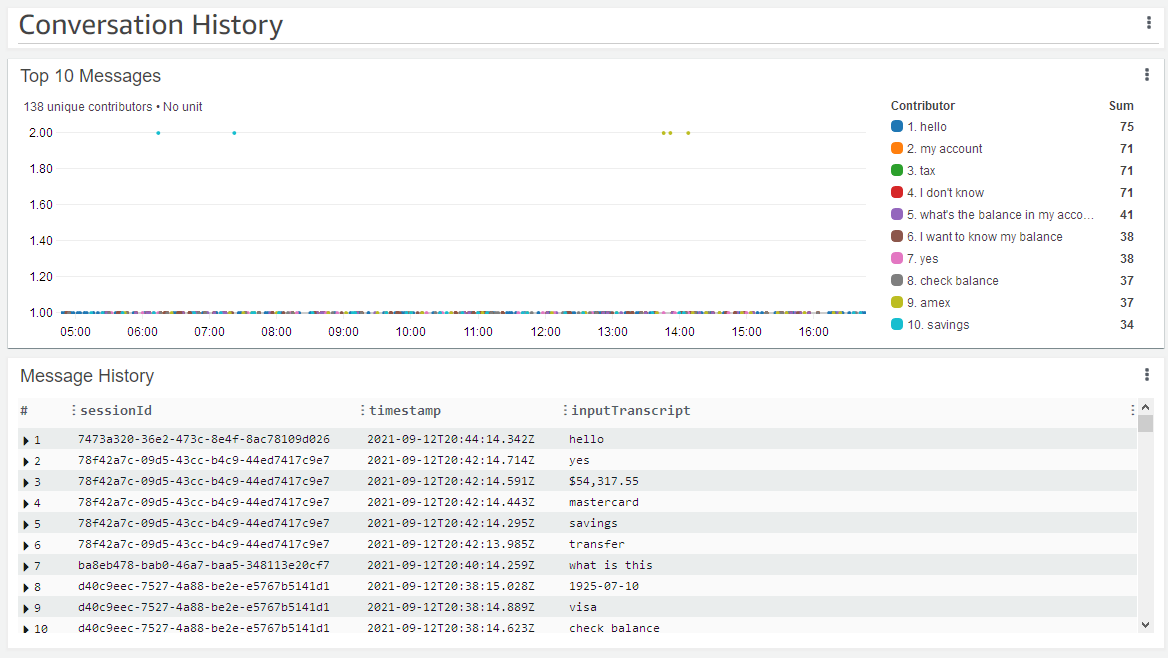
You can track conversations with a widget listing the top messages (utterances) sent to your bot and a table containing a history of messages. You can expand each message in the Message History section to look at conversation state details when the message was sent.
You can visualize utilization with heatmap widgets that aggregate sessions and intents by day or time. You can hover your pointer over blocks to see the aggregation values.
You can look at a chart containing conversation paths aggregated by sessions. The thickness of the connecting path lines is proportional to the usage. Grey path lines show forward flows and red path lines show flows returning to a previously hit intent in the same session. You can hover your pointer over the end blocks to see the aggregated counts. The conversation path chart is useful to visualize the most common paths taken by your end users and to uncover unexpected flows.
The dashboard shows tables that aggregate the top slots and session attributes values. The session attributes and slots are dynamically extracted from the conversation logs. These widgets can be configured to exclude specific session attributes and slots by modifying the parameters of the widget. These tables are useful to identify the top values provided to the bot in slots (data inputs) and to track the top custom application information kept in session attributes.
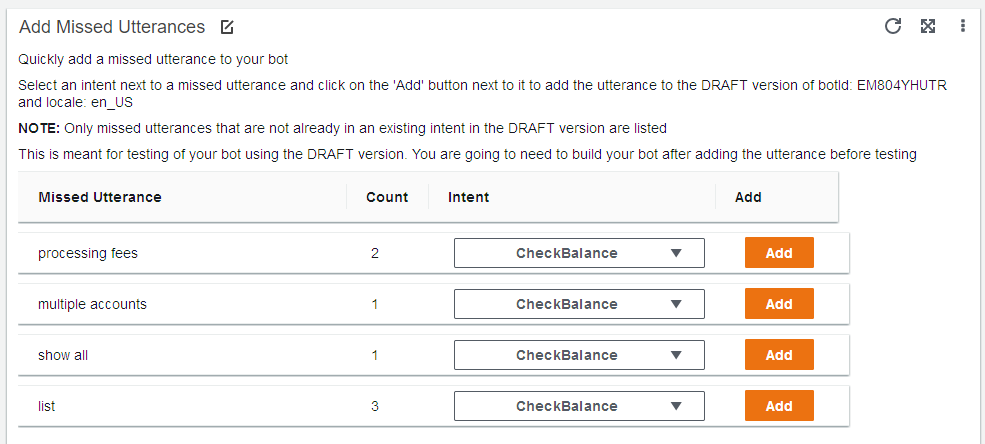
You can add missed utterances to intents of the Draft version of your bot with the Add Missed Utterances widget. For more information about bot versions, see Creating versions. This widget is optionally added to the dashboard if you set the ShouldAddWriteWidgets parameter to true when you deploy the solution.
CloudWatch features
This section describes the CloudWatch features used to create the dashboard widgets.
Custom metrics
The dashboard includes custom CloudWatch metrics that are created using metric filters that extract data from the bot conversation logs. These custom metrics track your bot activity, including number of messages and missed utterances.
The metrics are collected under a custom namespace based on the bot ID and locale ID. The namespace is named Lex/Activity/<BotID>/<LocaleID> where <BotId> and <LocaleId> are the bot and locale IDs that you passed when creating the stack. To see these metrics on the CloudWatch console, navigate to the Metrics section and look for the namespace under Custom Namespaces.
Additionally, the metrics are categorized using dimensions based on bot characteristics, such as bot alias, bot version, and intent names. These dimensions are dynamically extracted from conversation logs so they automatically create metrics subcategories as your bot configuration changes over time.
You can use various CloudWatch capabilities with these custom metrics, including alarms and anomaly detection.
Contributor Insights
Similar to the custom metrics, the solution creates CloudWatch Contributor Insights rules to track the unique contributors of highly variable data such as utterances and session IDs. The widgets in the dashboard using Contributor Insights rules include Top 10 Messages and Top 10 Sessions.
The Contributor Insights rules are used to create top-N metrics and dynamically create aggregation metrics from this highly variable data. You can use these metrics to identify outliers in the number of messages sent in a session and see which utterances are the most commonly used. You can download the top-N items from these widgets as a CSV file by choosing the widget menu and choosing Export contributors.
Logs Insights
The dashboard uses the CloudWatch Logs Insights feature to query conversation logs. Various widgets in the dashboard including the Missed Utterance History and the Message History use CloudWatch Logs Insights queries to generate the tables.
The CloudWatch Logs Insights widgets allow you to inspect the details of the items returned by the queries by choosing the arrow next to the item. Additionally, the Logs Insights widgets have a link that can take you to the CloudWatch Logs Insights console to edit and run the query used to generate the results. You can access this link by choosing the widget menu and choosing View in CloudWatch Logs Insights. The CloudWatch Logs Insights console also allows you to export the result of the query as a CSV file by choosing Export results.
Custom widgets
The dashboard includes widgets that are rendered using the custom widgets feature. These widgets are powered by Lambda functions using Python or JavaScript code. The functions use the D3.js (JavaScript) or pandas (Python) libraries to render rich visualizations and perform complex data aggregations.
The Lambda functions query your bot conversation logs using the CloudWatch Logs Insights API. The functions then use code to aggregate the data and output the HTML that is displayed in the dashboard. It obtains bot configuration details (such as intents and utterances) using the Amazon Lex V2 APIs or dynamically extracts it from the query results (such as slots and session attributes). The dashboard uses custom widgets for the following widgets: heatmaps, conversation path, add utterances management form, and top-N slot/session attribute tables.
Cost
The Amazon Lex V2 Analytics Dashboard Solution is based on CloudWatch features. See Amazon CloudWatch pricing for cost details.
Clean up
To clean up your resources, you can delete the CloudFormation stack. This permanently removes the dashboard and metrics from your account. For more information, see Deleting a stack on the AWS CloudFormation console.
Summary
In this post, we showed you a solution that provides insights on how your users interact with your Amazon Lex chatbot. The solution uses CloudWatch features to create metrics and visualizations that you can use to improve the user experience of your bot users.
The Amazon Lex V2 Analytics Dashboard Solution is provided as open source—use it as a starting point for your own solution, and help us make it better by contributing back fixes and features. For expert assistance, AWS Professional Services and other AWS Partners are here to help.
We’d love to hear from you. Let us know what you think in the comments section, or use the issues forum in the GitHub repository.
About the Author
Oliver Atoa is a Principal Solutions Architect in the AWS Language AI Services team.
Read MoreAWS Machine Learning Blog