

Monitoring databases is essential for any DBA, from dev-test databases to mission-critical databases. You want to capture system and user-defined events for monitoring and troubleshooting problems related to your database instance. MySQL records these events in error logs.
In this post, we show you how to monitor different events, such as deadlocks, access denied errors, and communications errors, in Amazon Aurora MySQL-Compatible Edition and Amazon RDS for MySQL using Amazon CloudWatch Logs send notifications using Amazon Simple Notification Service (Amazon SNS).
For information about using CloudWatch Logs to monitor databases in Amazon RDS for MySQL and MariaDB, check out Monitor Amazon Aurora MySQL, Amazon RDS for MySQL and MariaDB logs with Amazon CloudWatch.
Solution overview
Amazon Aurora MySQL-Compatible Edition and Amazon RDS for MySQL are managed database offerings from AWS that support the MySQL database engine. It takes a few clicks on the AWS Management Console to launch and connect to a MySQL database. Amazon RDS and Aurora instances are preconfigured with parameters and settings for the server type you choose. Both services can integrate with CloudWatch to provide metrics for instances, and both provide an option to export MySQL logs to publish to CloudWatch Logs.
With CloudWatch Logs, you can view metrics, analyze log data, and create real-time alarms. To work with CloudWatch Logs, we configure an RDS or Aurora instance to publish log data to a log group.
The following diagram illustrates the architecture of our solution, which sets up monitoring Amazon RDS or Aurora database error logs using CloudWatch and sending notifications with Amazon SNS.
Prerequisites
You should have the following prerequisites:
Aurora MySQL or Amazon RDS for MySQL
Access to the console and CloudWatch
An email address for notifications
MySQL Workbench or any tools to connect to your MySQL database
This post is applicable to Amazon RDS for MySQL Community Edition versions 5.6, 5.7, and 8.0 and Aurora MySQL 2.x and 1.x versions.
Walkthrough overview
You can configure your database instance to publish log data to a log group in CloudWatch Logs. With CloudWatch Logs, you can perform real-time analysis of the log data, and use CloudWatch to create alarms and view metrics. You can use CloudWatch to detect anomalous behavior in your environments, set alarms, visualize logs and metrics side by side, take automated actions, troubleshoot issues, and discover insights to keep your applications running smoothly.
You can configure your RDS for MySQL or Aurora MySQL database instance to publish log data to a log group in CloudWatch Logs. Then, you can perform real-time analysis of the log data. You can create a metrics filter based on the content of the log file and create alarms based on it.
In this post, we complete the following high-level steps:
Publish database logs to CloudWatch Logs from the console.
Create a filter pattern and CloudWatch alarm.
Then we walk you through use cases of enabling deadlock capturing events, checking communication errors, and monitoring for access denied errors.
Publish database logs to CloudWatch Logs
To publish your database logs to CloudWatch Logs, complete the following steps:
On the Amazon RDS console, choose Databases in the navigation pane.
Choose the name of the DB instance that you want to configure CloudWatch metrics for.
Choose Modify.
On the CloudWatch console, choose Log groups in the navigation pane.
In the Log exports section, select Error log to send the logs to CloudWatch Logs.
Choose Continue.
In the Scheduling of modifications section, choose Apply immediately, then choose Modify DB instance.
If you’re using Aurora, the database will remain online and no downtime is needed.
Create a filter pattern and CloudWatch alarm
To create a filter pattern and CloudWatch alarm, complete the following steps:
On the CloudWatch console, under Logs in the navigation pane, choose Log groups.
Select the RDS for MySQL error logs for your RDS DB instance (/aws/rds/instance/<Your-RDS-Instance-Name>/error).
If you’re using Aurora, a new log group is automatically created for the Aurora DB cluster under the prefix /aws/rds/cluster/cluster-name/log_type, in which cluster-name represents the DB cluster name, and log_type represents the log type.
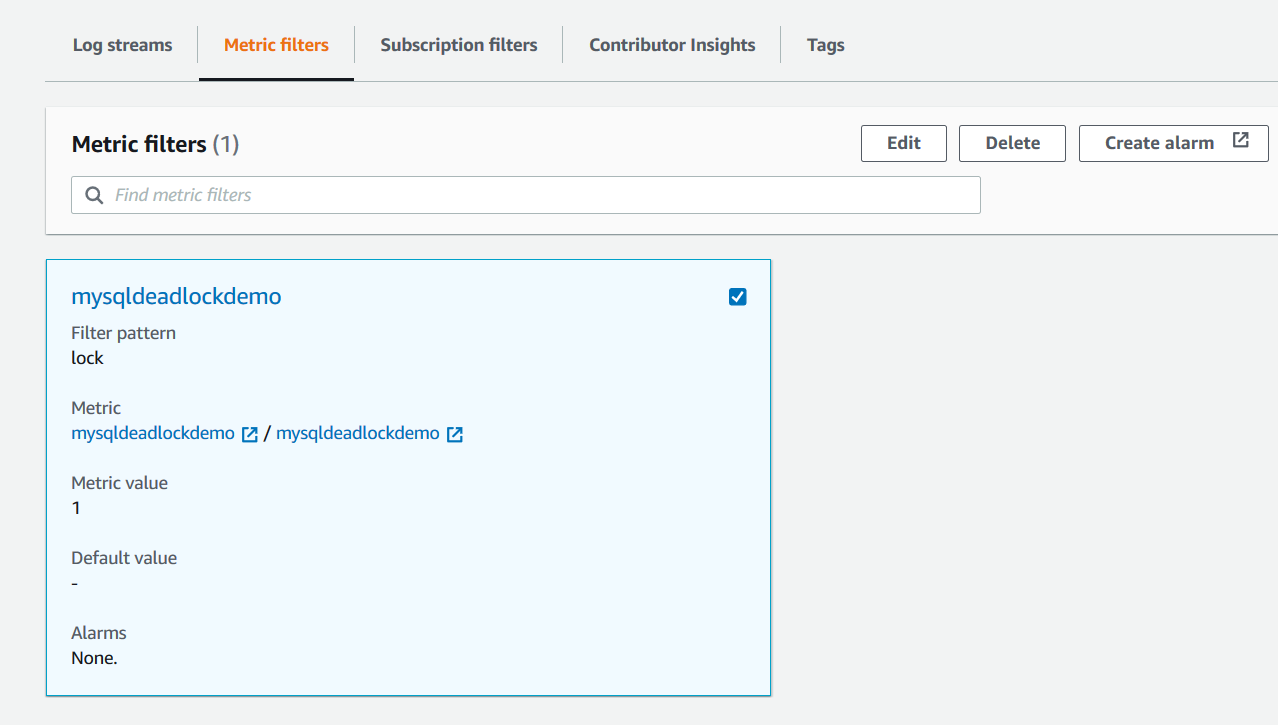
Choose Create metric filter.
In the Filter Pattern section, enter the word you want to monitor in the log file, such as deadlock/error/shutdown.
Choose Assign metric.
For Filter name and Metric name, enter deadlock.
Set the metric value to 1.
Choose Create filter.
After the metric filter is created, choose Create alarm.
On the Specify metric and conditions page, under Metric name, select name of metric (deadlock).
For Aurora MySQL, an instance-level deadlock metric is available in CloudWatch, which you can use to create an alarm in place of log filtering if necessary.
Under Statistic, choose Minimum.
Under Period, choose the time period for the alarm, for example, 1 minute.
In the Conditions section, for Threshold type, choose Static.
For Whenever Deadlock is, choose Greater > threshold.
For Than, enter 0.
Choose Next.
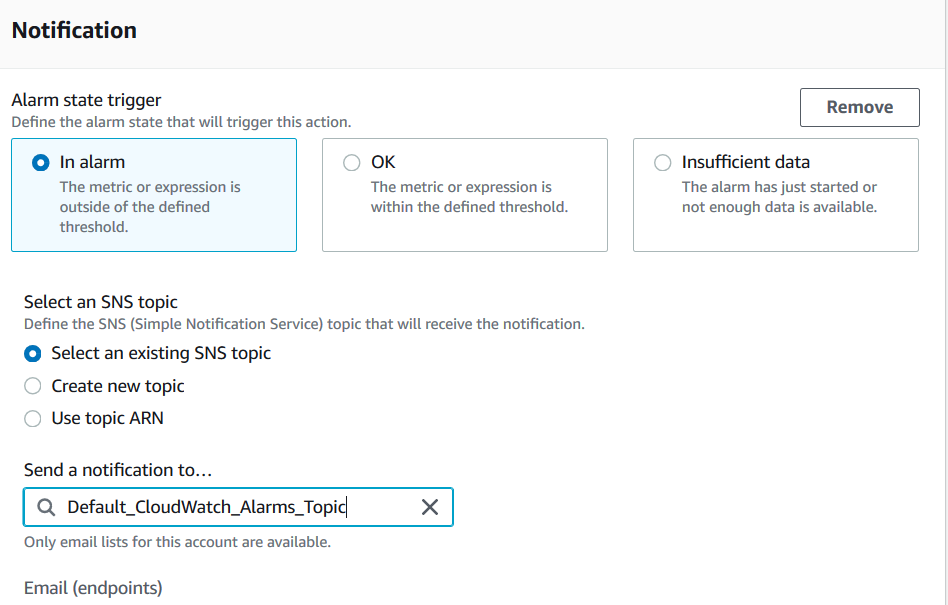
In the Notification section, under Alarm state trigger, select In alarm.
For Select an SNS topic, you can choose an existing topic or create a new topic using the email address you want to receive alerts.
For more information about SNS topics, see Subscribing to an Amazon SNS topic.
Choose Next.
In the Name and description section, enter an alarm name and description, and choose Next.
On the Preview and create page, review your alarm configuration, then choose Create alarm.
Confirm the notification in the email.
Capture deadlock events for Amazon RDS for MySQL
A deadlock can occur when transactions lock rows in multiple tables (through statements such as UPDATE or SELECT … FOR UPDATE), but in the opposite order. To capture deadlock events, complete the following steps:
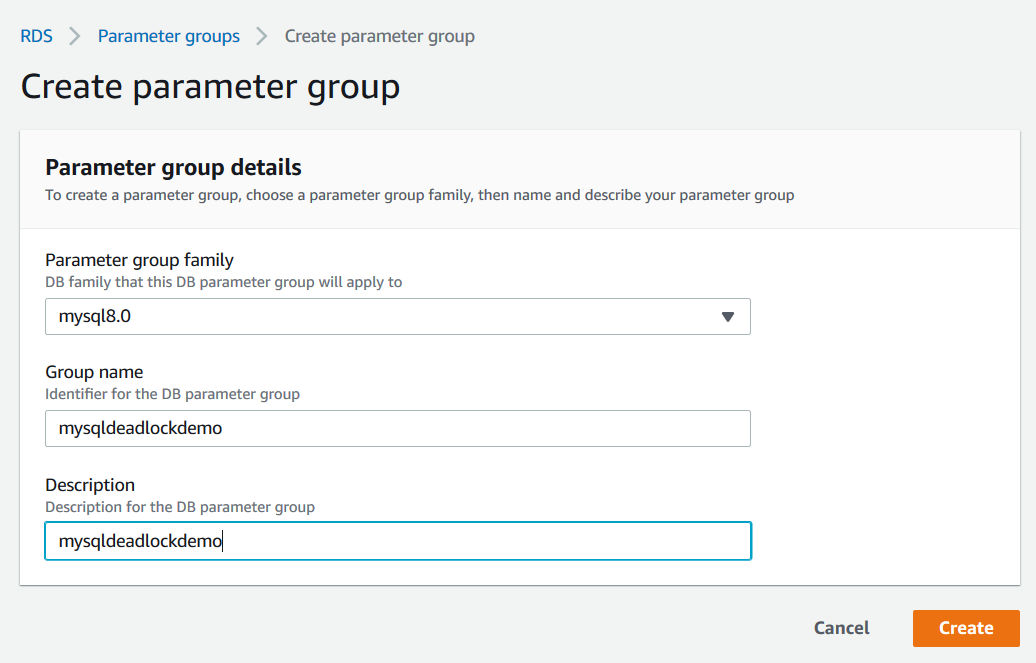
On the Amazon RDS console, choose Parameter groups in the navigation pane.
Choose Create parameter group.
For Parameter group family, choose the MySQL and edition you’re using.
Enter a group name and description.
Choose Create.
On the Parameter groups page, choose the group you created.
Choose Edit parameters, and select deadlock – innodb_print_all_deadlocks and innodb_deadlock_detect.
Edit the Values for both parameters to 1.
The Innodb_deadlock_detect parameter isn’t available in Aurora MySQL. Instead you must modify the innodb_print_all_deadlocks parameter using the DB parameter group in Aurora. Enabling this parameter can cause a performance impact on high throughput workloads.
Choose Preview changes.
On the next page, choose Save changes.
In the navigation pane, choose Databases.
In the DB identifier section, choose your RDS DB instance.
Choose Modify.
In the Database options section, for DB parameter group, choose the parameter group you created.
Creating a new parameter group and attaching it to an RDS DB instance requires that you reboot the RDS DB instance for the changes to take effect.
If you have a custom parameter group attached to the RDS DB instance, you can update deadlock parameters. Deadlock parameters are dynamic hence it doesn’t require a reboot of DB instances.
Now let’s simulate a deadlock in your MySQL database.
Connect to your MySQL database using MySQL Workbench or any preferred tool.
Create two query connections to the same MySQL instance and run the following commands in each connection.
Connection 1
Connection 2
You can see the deadlock detected error message as command output in the MySQL Workbench query output.
Now, go to CloudWatch alarms and check the alarm status.
You can also verify the email received from Amazon SNS. The following screenshot is the email that you receive when a deadlock is detected.
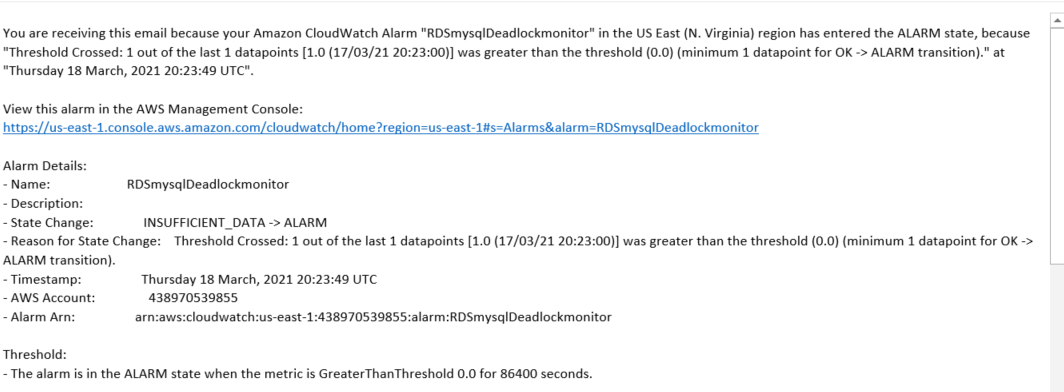
After you receive the email, you can go to MySQL Workbench to get the details of the queries involved in deadlock.
Run the following query using MySQL Workbench:
The following screenshot shows the output.
To learn more about deadlocks and how to handle deadlocks in MySQL, see How to Minimize and Handle Deadlocks.
Check communication errors
Another common error found in MySQL logs is related to communication errors.
If a client can’t connect, the server increments the Aborted_connects status variable. Unsuccessful connection attempts can occur for the following reasons:
A client attempts to access a database but has no privileges for it
A client uses an incorrect password
A connection packet doesn’t contain the right information
It takes more than connect_timeout seconds to obtain a connect packet
If a client successfully connects but later disconnects improperly or is stopped, the server increments the Aborted_clients status variable, and logs a stopped connection message to the error log. The cause can be any of the following:
The client program didn’t call mysql_close() before exiting
The client had been sleeping more than wait_timeout or interactive_timeout seconds without issuing any requests to the server
The client program ended abruptly in the middle of a data transfer
To follow communication error capturing events, we first enable detailed log monitoring in Amazon RDS for MySQL.
Create a custom parameter group and edit the parameter log_error_verbosity and set the value to 3.
For Aurora, this value is already 3; the default in Amazon RDS for MySQL is 1. Also, the parameter log_error_verbosity doesn’t exist in Aurora 5.6 (1.x); you can use the log_warnings parameter.
Attach the customer parameter group to Amazon RDS for MySQL.
Reproduce the problem by connecting to the MySQL database with the wrong password or keep the database connection open and restart the database in the middle of a data transfer.
Check the status of Aborted_clients and Aborted_Connections using the show global status
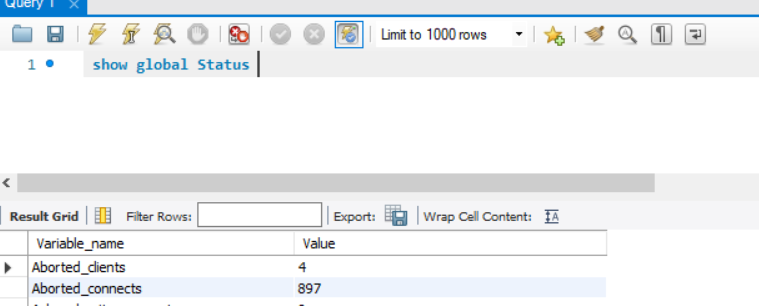
For additional connection-related information, check the Connection_errors_xxx status variables and the host_cache table.
Events are written to the MySQL error log and it is available in CloudWatch log events. You can create a metric filter and create an alert accordingly.
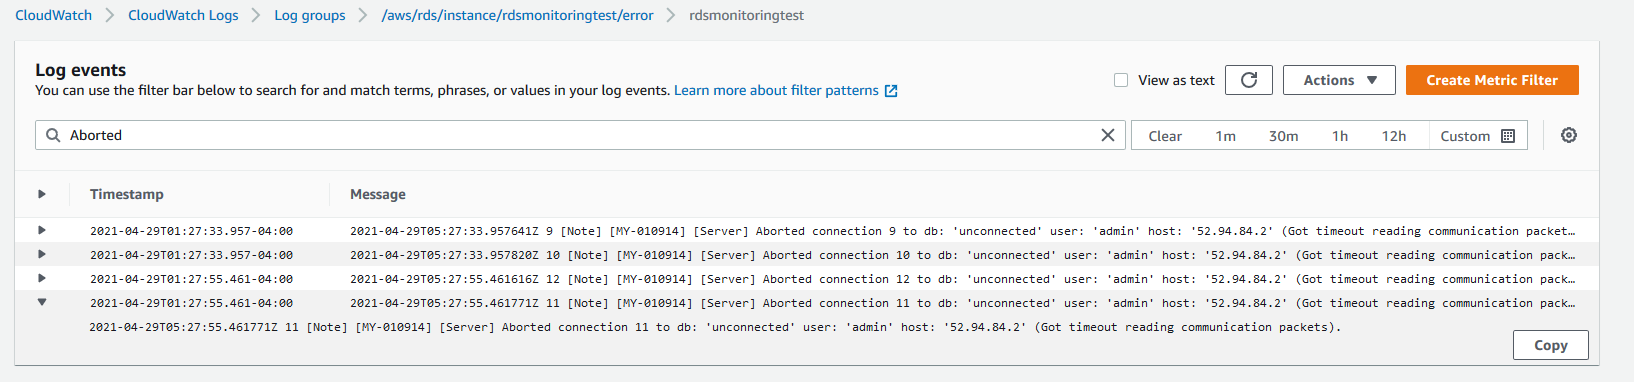
Monitor access denied errors
You can also monitor another set of common issues related to MySQL servers, which are access denied errors.
The following screenshot shows a sample event produced for an access denied error.
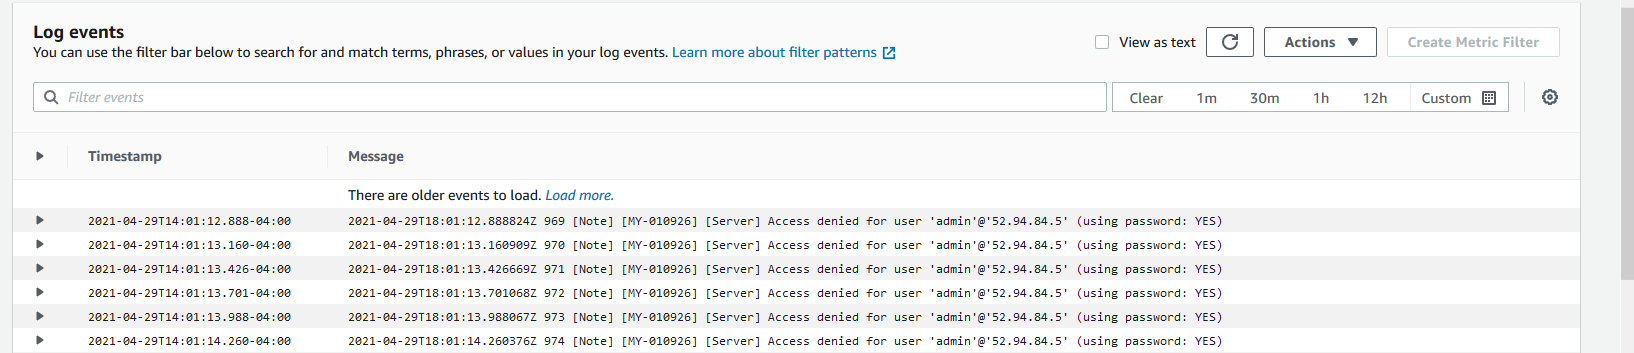
You can create a filter for access denied errors in a CloudWatch log metrics filter and send SNS notifications. For more information about using audit logging to get more information on connection errors, see Installing or Uninstalling MySQL Enterprise Audit.
Clean up
If you’re no longer using the resources in this post, you can clean up to avoid incurring unwanted charges. Delete the Aurora or RDS for MySQL instance and CloudWatch Logs.
Conclusion
In this post, we showed how to monitor an Aurora MySQL or Amazon RDS for MySQL database for any errors and integrate monitoring with CloudWatch Events and Amazon SNS. With this solution, you can automate your Aurora MySQL or Amazon RDS for MySQL error log files monitoring and alerting.
In our use case, you received email notifications for deadlock events in Aurora MySQL or RDS for MySQL databases. This helps automate deadlock reporting and can take appropriate actions to resolve deadlock conflicts.
You can use a similar setup for monitoring other Aurora MySQL or Amazon RDS for MySQL errors, such as access errors, communication errors, or any other Innodb errors.
To learn more about monitoring Aurora MySQL or Amazon RDS for MySQL, check out Monitoring OS metrics using Enhanced Monitoring and Monitoring with Performance Insights on Amazon RDS.
About the Author
Yogeshwari Barot is Microsoft Specialist Senior Solution Architect at AWS, she has 22 years of experience working with different Microsoft technologies, her specialty is in SQL Server and different database technologies. Yogi has in depth AWS knowledge and expertise in running Microsoft workload on AWS.
Read MoreAWS Database Blog