

You know the time when you want to see how your cloud deployment is behaving or if something is broken in production and your users might be impacted. You are scrambling because there are too many tools to look through to find and resolve the issue. That’s where Google Cloud’s operations suite comes in.
What is the operations suite?
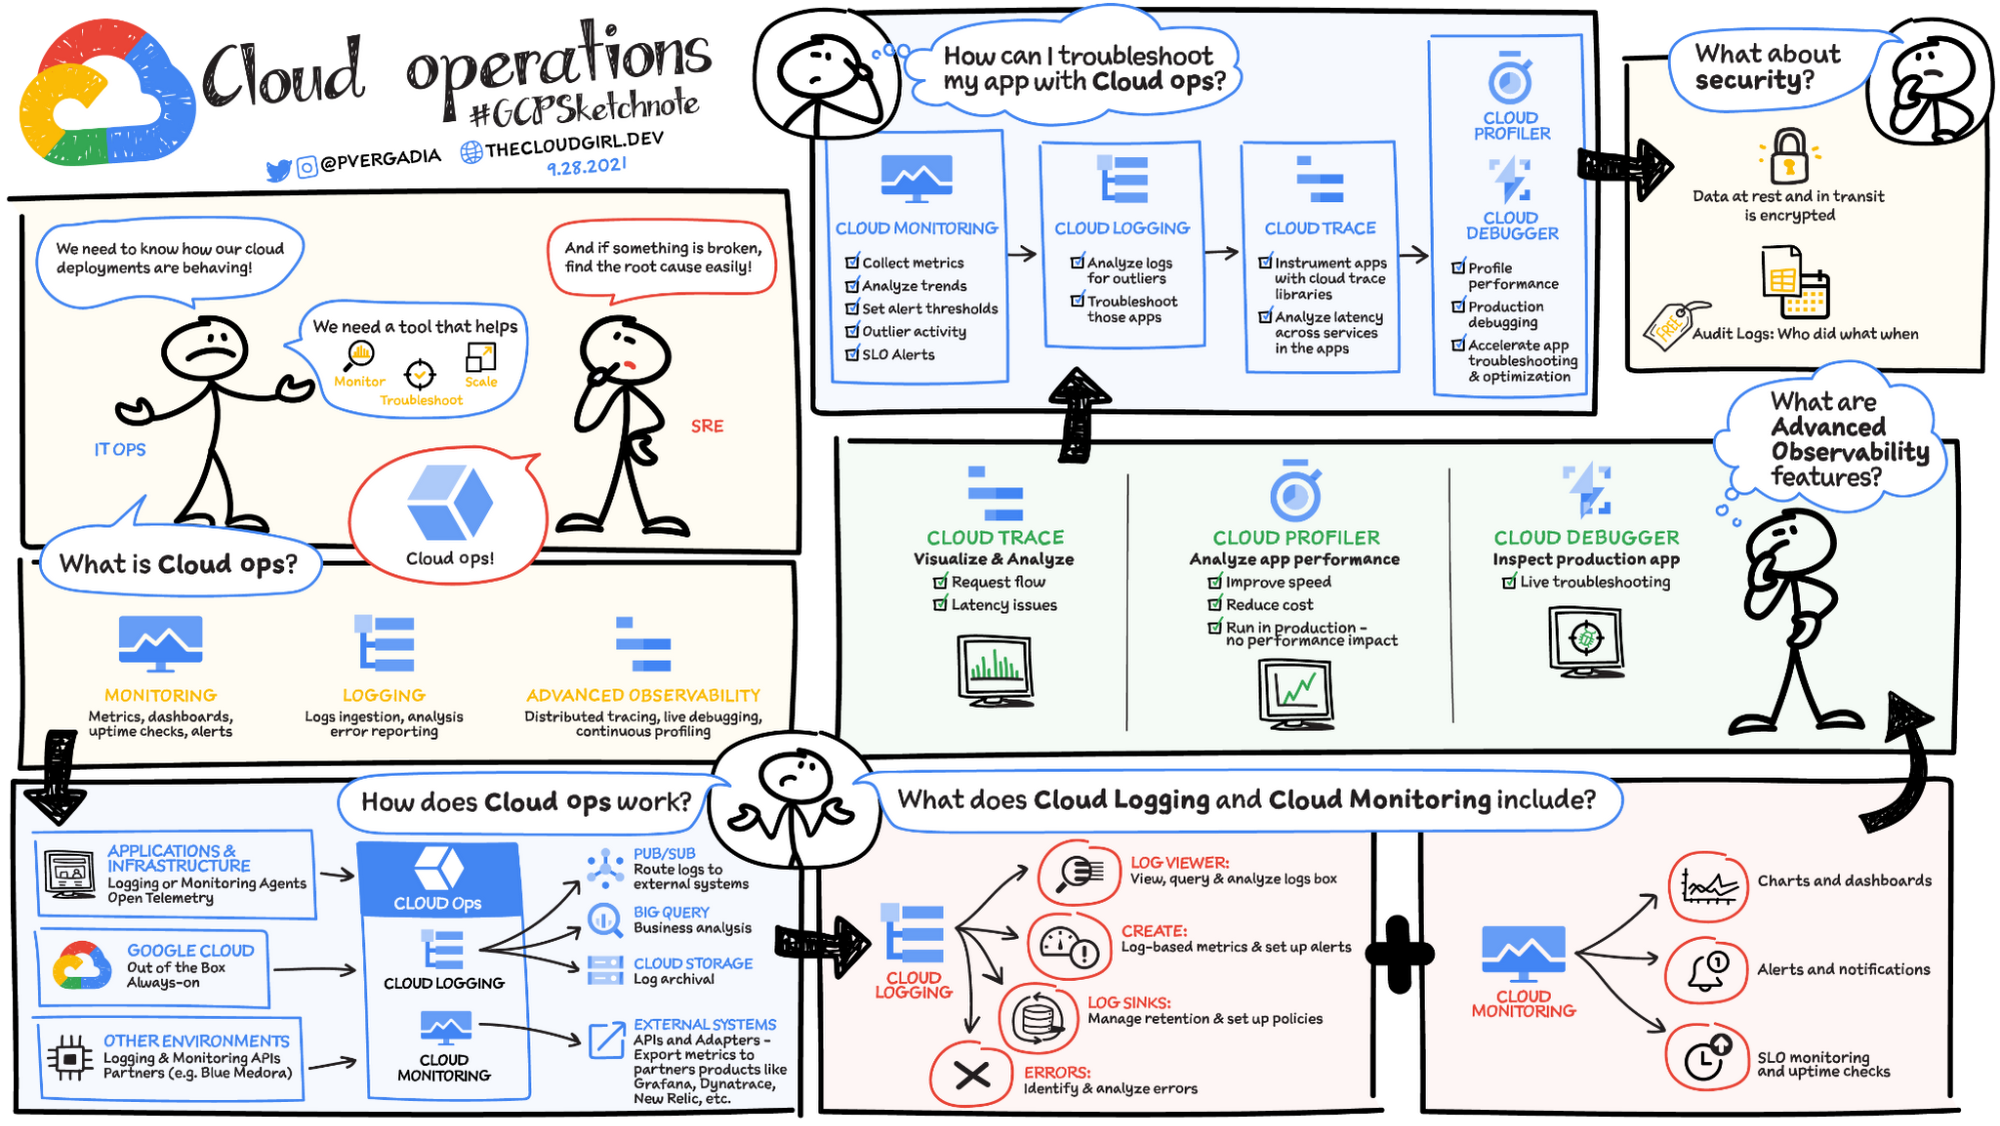
Google Cloud’s operations suite is made up of products to monitor, troubleshoot and operate your services at scale, enabling your DevOps, SREs, or ITOps teams to utilize the Google SRE best practices. It offers integrated capabilities for monitoring, logging, and advanced observability services like trace, debugger and profiler. The end-to-end operations solution includes built-in telemetry, out-of-box dashboards, recommendations, alerts and more:
Capturing signals
Monitoring systems
Managing incidents
Troubleshooting issues
What does Cloud operations include?
Cloud Logging: Fully managed and highly scalable service that aggregates log data from all your infrastructure and applications across Google Cloud into a single location. Cloud Logging collects log data from Google Cloud services automatically, and any custom log source, such as applications, on-prem sources or other clouds, through the Ops Agent, open source fluentd or an API. It provides complete control to decide how and where to store the logs, including keeping the logs in Cloud Logging, exporting them to Cloud Storage, or streaming the logs via Cloud Pub/sub to custom third party destinations. The Cloud Logging team recently introduced the preview of Log Analytics, which makes logs automatically available in BigQuery so you can get deeper insights and analyze the data alongside other business data. Logs Explorer gives you powerful capabilities to filter the logs, convert them to log-based metrics for monitoring, alerting, analyzing and visualizing.
Cloud Monitoring provides observability across your apps and infrastructure, regardless of where it is, Google Cloud, on-premise, or in other clouds. It supports a variety of metrics integrations and allows you to define custom metrics unique to your use cases and even send those metrics to external systems. Using the metrics explorer and monitoring query language you can analyze these metrics on the fly, identify correlations and easily add the corresponding charts to a dashboard. You can use out-of-box or custom built dashboards to get a consolidated view of the health of your infrastructure, service, or application and easily spot anomalies.But we cannot sit around all day looking at dashboards. Cloud monitoring provides Alerting, you can create policies to alert on performance metrics, uptime checks and service level indicators.
Application Performance Management (APM)
Application Performance Management (APM) combines monitoring and troubleshooting capabilities of Cloud Logging and Cloud Monitoring with Cloud Trace, Cloud Debugger, and Cloud Profiler, to help you reduce latency and cost, so you can run more efficient applications.
Cloud Trace provides visualization and analysis to understand request flow, service topology and latency issues in your app.
Cloud Debugger allows you to inspect the state of running applications after deployment, without needing to stop or slow it down.
Cloud Profiler continually analyzes your code’s performance on each service, so that you can improve its speed and reduce your costs. And it is designed to run in production with effectively no performance impact
While Trace is used to track relationships and latency between services, Profilertracks this across the individual functions in your codebase and Debuggerhelps find the root cause from method to the specific problematic piece of code.
How does Cloud operations work?
You can use the tools directly in the cloud console or via APIs to access the data in your IDE. Cloud Operations tools help Reduce Mean Time to Recover (MTTR) and optimize your application’s performance.
Cloud Logging automatically ingests Google Cloud audit and platform logs so that you can get started right away. You can also ingest logs and metrics from other environments and on-premises using the API. You can then use:
Log Viewer to view, query and analyze logs
Create log based metrics to setup alerts
Create log sinks to manage retention and set up policies
Cloud Monitoring provides a view of all system metrics created by Google Cloud services, which are available at no cost. Cloud Monitoring also integrates with a variety of third party providers for non Google Cloud monitoring services. Custom metrics can also be ingested from applications and non-Google Cloud sources via agents or API. Using ingested metrics, you can create:
Charts and dashboards
Alerts and notifications
SLO Monitoring and uptime checks
If you are the GKE user, you configure Cloud Operations for GKE and include managed Prometheus support. The metrics that are generated by services using the Prometheus exposition format can be exported from the cluster and made visible as external metrics in Cloud Monitoring.
From the security perspective, all your data is encrypted at rest and in transit. All your security-focused audit logs are automatically available in Cloud Logging telling you who did what, where and when. With Access transparency logs you can always stay in compliance because it captures the actions Google personnel take while offering you support.
Interested in getting started with Cloud Operations? Check out the documentation here.
For more #GCPSketchnote and similar cloud content, follow me on twitter @pvergadia and keep an eye out on thecloudgirl.dev
Cloud BlogRead More