Today we’re announcing a new Google Cloud Dataset from Open Source Insights which will help developers better understand the structure and security of the software they use. This dataset provides access to critical software supply chain information for developers, maintainers and consumers of open-source software.
Your users rely not only on the code you write, but also on the code your code depends on, the code that code depends on, and so on. This web of dependencies forms a dependency graph, and while each node in the graph brings useful functionality to your project, they may also introduce security vulnerabilities, licensing issues, or other surprises, as recent events like the log4j issue demonstrated. To understand your code, you must have an accurate view of its dependency graph.
The Open Source Insights project scans millions of open-source packages from the npm, Go, Maven, PyPI, and Cargo ecosystems, computes their dependency graphs, and annotates those graphs with security advisories, license information, popularity metrics, and other metadata. The dataset is regularly updated, keeping it current and relevant while also providing a snapshotted view of change over time. Generated by resolving each package’s dependency constraints, this data provides precise, accurate, and actionable dependency graphs.
The rate of change in open-source packages is significant. Our analysis shows that roughly 15% of the packages in npm see changes to their dependency sets each day, and for 40,000 of those packages (2% of packages in npm) this results in a change to their license or advisory set. Keeping up with these changes is critical yet intractable without good tooling.
This new dataset allows anyone to use Google Cloud BigQuery to explore and analyze the dependencies, advisories, ownership, license and other metadata of open-source packages across supported ecosystems, and how this metadata has changed over time.
We are eagerly looking forward to seeing how this data will be used. Whether you’re a developer, security engineer, or researcher, you can use this public dataset to analyze components of your software supply chain, and integrate this information with your existing tools and pipelines.
How the Open Source Insights dataset works
We’re bringing Google’s mission to “organize the world’s information and make it universally accessible and useful” to open-source software. Open Source Insights examines each package in the packaging systems we cover, including npm, Go, Maven (Java), PyPI (Python), and Cargo (Rust) and more to come. A full, detailed graph of its dependencies and their properties is constructed and annotated with security advisory, license, owner, release information and other metadata, making a rich dataset covering entire package management language ecosystems.
The dataset is updated regularly, making this a valuable resource for tracking ecosystem level changes over time, analyzing the scope and impact of issues, or integrating into custom dashboards and build systems.
Getting started with the Open Source Insights dataset
To begin exploring these public dataset tables, you can look at the schema and try some sample queries, like the following examples. As with all other Google Cloud Datasets, users can obtain access without charges of up to 1TB/month in queries and up to 10GB/month in storage through BigQuery’s free tier. SQL queries above these thresholds are subject to regular BigQuery pricing. Users can also leverage the BigQuery sandbox to access BigQuery without the need to create a Google Cloud account or provide credit card information, subject to the sandbox’s limits and BigQuery’s free tier thresholds.
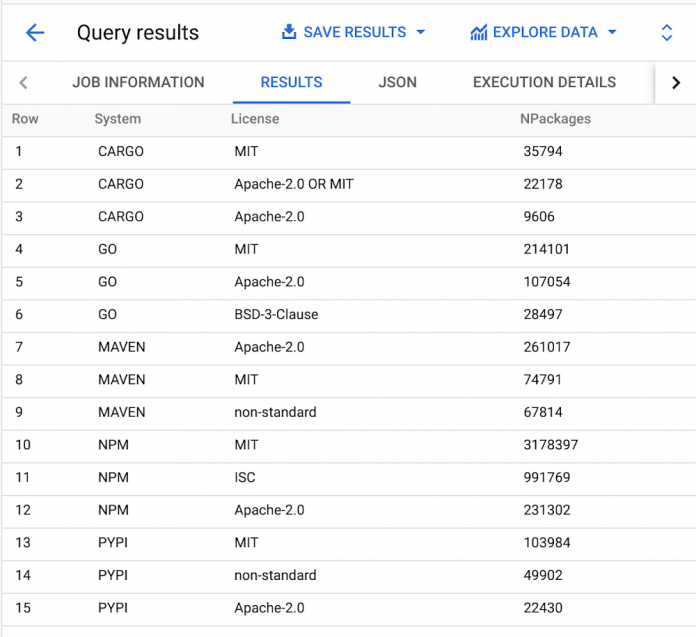
What are the most common licenses across each ecosystem?
We can aggregate the license data across packages within each dependency management system to get a list of the top three licenses per system. To do so we first find the newest snapshot in the dataset. Then within that snapshot we count the number of unique packages with at least one version using each license (multiple versions of a package are not double counted).
What are the most depended upon package versions?
We can use the dependency graphs to identify the most depended upon package versions in the cargo ecosystem. To do so, we filter all packages and available versions for just the release with the highest semantic version per package. We then sum the number of these highest release versions that depend on each version.
What’s next for software supply chain security?
We hope this dataset will make it easier for developers to learn more fundamental information about their dependencies. You can also explore the Open Source Insights website for the latest open-source software insights and visualizations, learn more about our open source security and software supply chain security solutions at the upcoming Google Cloud Security Summit on May 17.
Cloud BlogRead More


