

As artificial intelligence (AI) and machine learning (ML) technologies continue to proliferate, using ML models plays a crucial role in converting the insights from data into actual business impacts. Operational ML means streamlining every step of the ML lifecycle and deploying the best models within the existing production system. And within that production system, the models may interact with various processes, such as testing, performance tuning of IT resources, and monitoring strategy and operations.
One common pitfall is a lack of model performance monitoring and proper model retraining and updating, which could adversely affect business. Nearly continuous model monitoring can provide information on how the model is performing in production. The monitoring outputs are used to identify the problems proactively and take corrective actions, such as model retraining and updating, to help stabilize the model in production. However, in a real-world production setting, multiple personas may interact with the model, including real users, engineers who are troubleshooting production issues, or bots conducting performance tests. When inference requests are made for testing purposes at the production endpoint, it may cause false positive detection of violations for the model monitor. To avoid this, we must filter out the test records from the calculation of model monitoring metrics.
Amazon SageMaker is a fully managed service that enables developers and data scientists to build, train, and deploy ML models quickly and easily at any scale. After you train an ML model, you can deploy it on SageMaker endpoints that are fully managed and serve inferences in real time with low latency. After you deploy your model, you can use Amazon SageMaker Model Monitor to monitor your ML model’s quality continuously in real time. You can also configure alerts to notify and initiate actions if any drift in model performance is observed. Early detection of these deviations enables you to take corrective actions, such as collecting new training data, retraining models, and auditing upstream systems without manually monitoring models or building additional tooling.
In this post, we present how to build a record filtering method based on sets of business criteria as part of the preprocessing step in Model Monitor. The goal is to ensure that only the actual production records are sent to Model Monitor for analysis, reflecting the actual usage of the production endpoint.
Solution overview
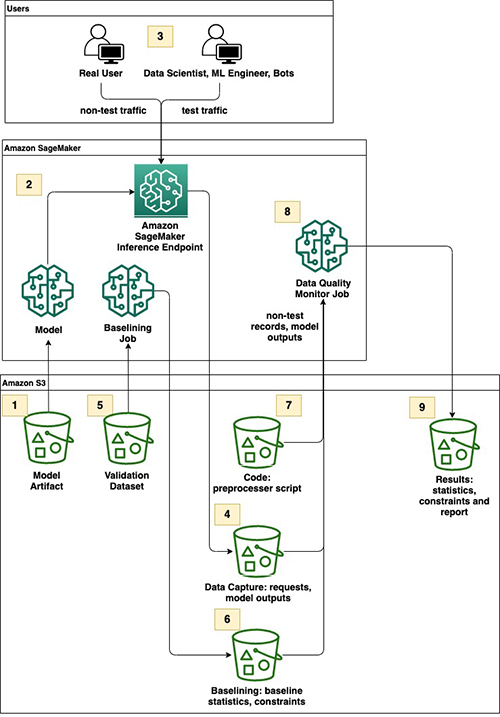
The following diagram illustrates the high-level workflow of record filtering using a preprocessor script with Model Monitor.
The workflow includes the following steps:
The Model Artifact Amazon Simple Storage Service (Amazon S3) bucket contains model.tar.gz, the XGBoost churn prediction model pretrained on the publicly available dataset mentioned in Discovering Knowledge in Data by Daniel T. Laros. For more information about how this model artifact was trained offline, see the Customer Churn Prediction with XGBoost notebook example on GitHub.
The model is deployed to an inference endpoint with data capture enabled.
Different personas send model prediction request traffic to the endpoint.
The Data Capture bucket stores capture data from requests and responses.
The Validation Dataset bucket contains the validation dataset required to create a baseline from a validation dataset in Model Monitor.
The Baselining bucket stores the output files for dataset statistics and constraints from Model Monitor’s baselining job.
The Code bucket contains a custom preprocessor script for Model Monitor.
Model Monitor data quality initializes a monitoring job.
The Results bucket contains outputs of the monitoring job, including statistics, constraints, and a violations report.
Prerequisites
To implement this solution, you must have the following prerequisites:
Python 3.7 or greater
Amazon SageMaker Studio
Amazon SageMaker Python 3 (Data Science) kernels
AmazonSageMakerFullAccess policy (you can further restrict this to least privileges based on your use case)
Set up the environment
To set up your environment, complete the following steps:
Launch Studio from the AWS Management Console.
If you haven’t created Studio in your account yet, you can manually create one by following Onboard to Amazon SageMaker Studio Using Quick Start. Alternatively, you can use an AWS CloudFormation template (see Creating Amazon SageMaker Studio domains and user profiles using AWS CloudFormation), which automates the creation of Studio in your account.
On the File menu, choose Terminal to launch a new terminal within Studio.
Clone the GitHub repo in the terminal:
Navigate to the directory amazon-sagemaker-data-quality-monitor-custom-preprocessing in Studio.
Open Data_Quality_Custom_Preprocess_Churn.ipynb.
Select Data Science Kernel and ml.t3.medium as an instance type to host the notebook to get started.
The rest of this post dives into a notebook with the various steps involved in designing and testing filtering records using a preprocessor with Model Monitor. We use a pretrained and deployed XGBoost churn prediction model. For detailed notebooks on other Model Monitor capabilities, see the model quality explainability notebook examples on GitHub. Beyond the steps discussed in this post, there are other steps necessary to import libraries and set up AWS Identity and Access Management (IAM) permissions. You can start with the README, which has a more detailed explanation of each step. Alternatively, you can go directly to the code and walk through with the notebook that you cloned in Studio.
Deploy the pretrained XGBoost model with script mode
First, we upload the pretrained model artifacts to Amazon S3 for deployment:
Because the model was trained offline using XGBoost, we use XGBoostModel from the SageMaker SDK to deploy the model. We provide the inference entry point in the source directory because we have a custom input parser for JSON requests. We also need to ensure that Flask Response is returned to match both input and output content types exactly. It is a necessary step for Model Monitor to work for the image running Gunicorn/Flask. The content type of output data captured by Model Monitor, which only works with CSV or JSON, is Base64 by default unless Response() explicitly converts it to a specific type. The following are the custom input_fn and output_fn. Currently, the implementation is for a single JSON record, but you can easily extend it to multiple records for batch processing.
To enable data capture for monitoring the model data quality, you can specify the options such as enable_capture, sampling_percentage, and destination_s3_uri in the DataCaptureConfig object when deploying to an endpoint. For example, unless you expect your endpoint to have high traffic or require a down-sample, you can capture all incoming records by providing 100% in sampling percentage. More information on DataCaptureConfig can be found in the Model Monitor documentation. In the following code, we specify the SageMaker XGBoost model framework version and provide a path for an entry inference script that we reviewed previously:
After we confirm that the model has been deployed, we can move on to the next step to review the implementation of the filtering mechanism in the preprocessing script for Model Monitor.
Implement a filtering mechanism in the preprocessor script
As previously discussed, we want to exclude test inference records from downstream monitoring reports. You can implement a rule-based filtering mechanism by parsing metadata provided in CustomAttributes in a request header. The following code illustrates how to send custom attributes as key-value pairs using the Boto3 SageMaker Runtime client:
We recommend using CustomAttributes to send the required metadata for simplicity. You can optionally choose to include metadata as part of inference records as long as your entry point inference reflects the change and extraction of input features in input records doesn’t break. Next, we review a provided preprocessor script that contains a filtering mechanism.
As illustrated in the following code, we extend the built-in mechanisms of Model Monitor by providing a custom preprocessor function. First, we extract testIndicator information from custom attributes and use this information to set the is_test variable to either True, when it’s a test record, or False otherwise. If we want to skip test records without breaking a monitor job, we can return [] to indicate that the object is an empty set of rows. Note that returning {} results in an error because it’s considered to be an object having an empty row, which SageMaker doesn’t expect.
Moreover, we convert the probability of model output into an integer type for non-test records. This step ensures that the data type is consistent with that of the ground truth label in the validation dataset. We demonstrate in following sections how this step can help you avoid false positive violations in monitoring. Model quality monitoring has its native way of handling the conversion, but this workaround is necessary for data quality monitoring.
Next, we insert the output as the first item into input features, ensuring that the columns’ number and order match exactly with the validation dataset. Although monitoring model output may seem unnecessary for data quality monitoring, we recommend not skipping this step because other types of monitoring may depend on that information to be provided. Finally, the function returns a key-value pair with zero-padded index numbers and corresponding output and input features. This is done to avoid any misalignment of input features caused by sorting of column names by Spark processing. Note that 20 is a magic number because 10**20 is large enough to cover numbers of feature columns in most cases.
Finally, SageMaker applies preprocessing for each row and aggregates the results on your behalf. If you have multiple inference records in a single inference request like mini-batch, you need to consider it in your code beyond the sample code we provide. At the time of writing this post, the preprocessing step in Model Monitor doesn’t publish any logs to Amazon CloudWatch, although this may change in the future. If you need to debug your custom preprocessing script, you may want to write and save your logs inside the container under the directory /opt/ml/processing/output/ so that you can access it later in your S3 bucket.
Now that we have reviewed how the preprocessing mechanism is implemented, we upload the script to the Amazon S3 location using the following code:
We can now move on to the next step: creating a monitor schedule.
Create a Model Monitor schedule (data quality only)
Continuous model monitoring involves scheduled analysis of incoming inference records and the creation of metrics relative to baseline metrics. The SageMaker SDK simplifies generating a set of constraints and summary statistics that describes the constraints as a reference. We upload the validation dataset with a column header and ground truth label to Amazon S3, which was used for offline training as a suitable baseline dataset. Decisions around whether to include a ground truth label in the baseline dataset depend on your use case and preference, because a data quality monitor certainly works without ground truth label data. Note that if you exclude ground truth here, you need to exclude inferences from monitoring similarly.
After confirming that the baseline dataset is uploaded to Amazon S3, we create baseline constraints, statistics, and a Model Monitor schedule for the deployed endpoint in one step using a custom wrapper class, DemoDataQualityModelMonitor. Under the hood, the DefaultModelMonitor.suggest_baseline method initiates a processing job with a managed Model Monitor container with Apache Spark and the AWS Deequ library to generate the constraints and statistics as a baseline. After the baselining job is complete, the DefaultModelMonitor.create_monitoring_schedule method creates a monitor schedule.
After monitor schedule creation is complete, we can move on to the final step, which is functional testing of the implemented filter with artificial payloads.
Test scenarios
We can test the following two scenarios to confirm that the filtering is working as expected. The first scheduled monitor run isn’t initialized until at least an hour after creating the schedule, so you can either wait or manually start a monitoring job using preprocessing. We use the latter approach for convenience. Fortunately, a utility tool already exists for this purpose and is available in this GitHub repo. We also provided a wrapper method, ArtificialTraffic.generate_artificial_traffic. You can pass column names and predefined static methods to populate bogus inputs and monotonically increase transactionId each time the endpoint is invoked.
First scenario
Our first test scenario includes the following steps:
Send a record that we know won’t create any violations. To do this, you can use a method, generate_artificial_traffic, and set the config variable to empty list. Also, set the testIndicator in custom attributes to ’false’ to indicate that it’s not a test record. This is illustrated in the following code:
Send another record that creates a violation. This time, we pass a set of dictionaries in the config variable to create bogus input features. We also set testIndicator to ’true’ to skip this record for the analysis. The following code is provided:
Manually start a monitor job using the run_model_monitor_job_processor method from the imported utility class and provide parameters such as Amazon S3 locations for baseline files, data capture, and a preprocessor script:
In the Model Monitor outputs, confirm that constraint_violations.json shows violations: [] 0 items and “dataset: item_count:” in statistics.json shows 1, instead of 2.
This confirms that Model Monitor has analyzed only the non-test record.
Second scenario
For our second test, complete the following steps:
Send N records that we know that creates violations, such as data_type_check and baseline_drift_check. Set the testIndicator in custom attributes to “false”. The following code illustrates this:
In the Model Monitor outputs, confirm that constraint_violations.json shows more than one violation item and “dataset: item_count:” in statistics.json shows greater than 1000. An extra item is a carry-over from the first scenario testing.
This confirms that sending test records as inference records creates false positive violations if testIndicator isn’t set correctly.
Clean up
We can delete the Model Monitor schedule and endpoint we created earlier. You could wait until the first monitor schedule starts; the result should be similar to what we confirmed from testing. You could also experiment with other testing scenarios. When you’re done, run the following code to delete the monitoring schedule and endpoint:
Don’t forget to shut down resources by stopping running instances and apps to avoid incurring charges from SageMaker.
Conclusion
Model Monitor is a powerful tool that lets organizations quickly adopt continuous model monitoring and monitoring strategy for ML. This post discusses how you can use a preprocessing mechanism to design a filter for inference records based on sets of business criteria to ensure that your testing infrastructure doesn’t pollute production data. The notebook included in this post provides an example of a custom preprocessor script that you can extend for different use cases quickly.
To get started with Amazon Sagemaker Model Monitor, check out the following resources:
Visit the Amazon SageMaker service page to learn more.
Please send us feedback, either on the AWS forum for Amazon SageMaker, or through your AWS support contacts.
Find other Amazon SageMaker Model Monitor examples in our GitHub repository
About the Authors
Kenny Sato is a Data and Machine Learning Engineer at AWS Professional Services, guiding customers on architecting and implementing machine learning solutions. He received his master’s in Computer Engineering from Virginia Tech. In his spare time, you can find him in his backyard, or out somewhere playing with his lovely daughters.
Hemanth Boinpally is a Machine Learning Engineer at AWS Professional Services, guiding customers on building and architecting AI/ML solutions. He received his bachelor’s and master’s in Computer Science. In his spare time, you can find him listening to podcasts or playing sports.
David Nigenda is a Senior Software Development Engineer on the Amazon SageMaker team, currently working on improving production machine learning workflows, as well as launching new inference features. In his spare time, he tries to keep up with his kids.
Read MoreAWS Machine Learning Blog