

We’re excited to announce that you can now automatically monitor the accuracy of your Amazon Forecast predictors over time. As new data is provided, Forecast automatically computes predictor accuracy metrics, providing you with more information to decide whether to keep using, retrain, or create new predictors.
Monitoring predictor quality and identifying deterioration in accuracy over time is important to achieving business goals. However, the processes required to continuously monitor predictor accuracy metrics can be time-consuming to set up and challenging to manage: forecasts have to be evaluated, and updated accuracy metrics have to be computed. In addition, metrics have to be stored and charted to understand trends and make decisions about keeping, retraining, or recreating predictors. These processes can result in costly development and maintenance burdens, and place meaningful operational stress on data science and analyst teams. And for customers not willing to take on this time-consuming process (they would prefer to retrain new predictors even when not needed), this wastes time and compute.
With today’s launch, Forecast now automatically tracks predictor accuracy over time as new data is imported. You can now quantify your predictor’s deviation from initial quality metrics and systematically evaluate model quality by visualizing trends, and make more informed decisions about keeping, retraining, or rebuilding your models as new data comes in. Predictor monitoring can be enabled for new predictors at inception, or turned on for existing models. You can enable this feature with one click on the AWS Management Console or using Forecast APIs.
Predictor accuracy over time
A predictor is a machine learning model created at a point in time, using an original set of training data. After a predictor is created, it’s used on an ongoing basis over days, weeks, or months into the future to generate time series forecasts with new ground truth data generated through actual transactions. As new data is imported, the predictor generates new forecasted data points based on the latest data provided to it.
When a predictor is first created, Forecast produces accuracy metrics such as weighted quantile loss (wQL), mean absolute percentage error (MAPE), or root mean squared error (RMSE) to quantify the accuracy of the predictor. These accuracy metrics are used to determine whether a predictor will be put into production. However, the performance of a predictor will fluctuate over time. External factors such as changes in the economic environment or in consumer behavior can change the fundamental factors underlying a predictor. Other factors include new products, items, and services that may be created; changes in the financial or economic environment; or changes in the distribution of data.
For example, consider a predictor trained when a certain color of a product was popular. Months later, new colors may appear or become more popular and the distribution of values change. Or a shift occurs in the business environment that modifies long-standing purchasing patterns (such as from high-margin to low-margin products). All things considered, the predictor may need to be retrained, or a new predictor may need to be created to ensure highly accurate predictions continue to be made.
Automated predictor monitoring
Predictor monitoring is designed to automatically analyze your predictor’s performance as new ground truth time series data becomes available and is used to create new forecasts. This monitoring provides you with continuous model performance information, and saves you time so you don’t have to set up the process yourself.
If predictor monitoring is enabled in Forecast, each time you import new data and produce a new forecast, performance statistics are updated automatically. Until now, these performance statistics were only available when the predictor was initially trained; now these statistics are produced on a continuous basis using new ground truth data, and can be actively monitored to gauge predictor performance.
This allows you to use predictor performance statistics to decide when to train or retrain a new predictor. For example, as the average wQL metric deviates from the initial baseline values, you can determine whether to retrain a new predictor. If you decide to retrain a predictor or create a new one, you can begin generating new forecasted data points using the more accurate predictor.
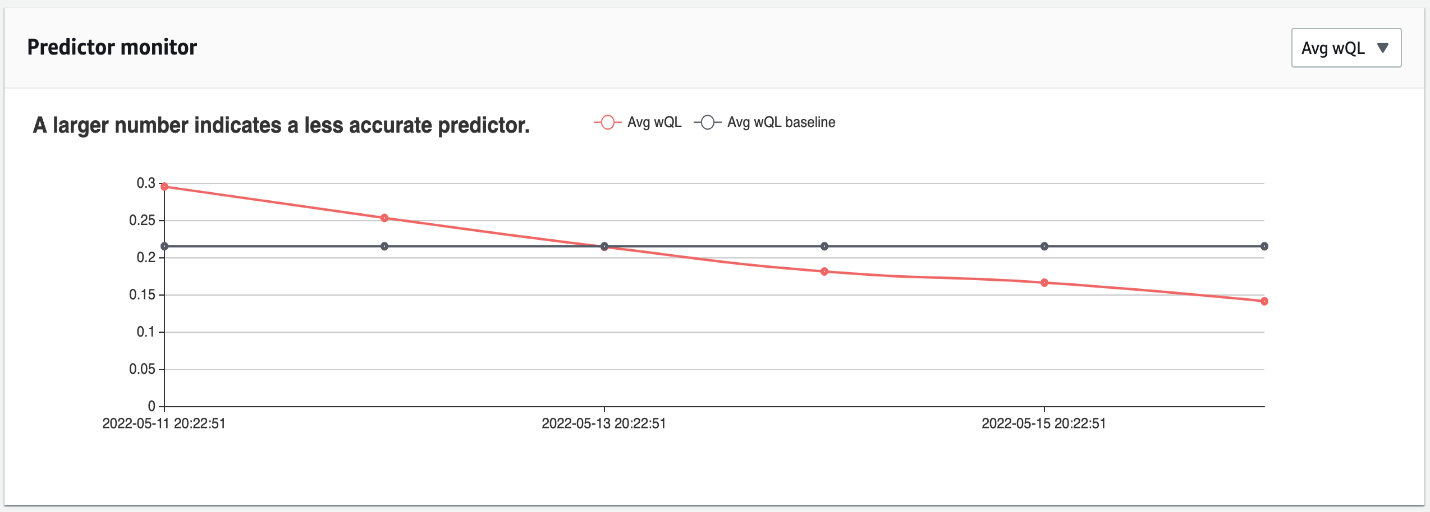
The following graphs provide two examples of predictor monitoring. In the first chart, the average wQL metric is decreasing from the baseline (the initial value when the predictor was trained), indicating that forecast accuracy is increasing over time. The chart shows average wQL dropping from 0.3 to 0.15 over the course of a few days, meaning that forecast accuracy is increasing. In this case, there is no need to retrain the predictor because it’s producing more accurate forecasts than when it was first trained.
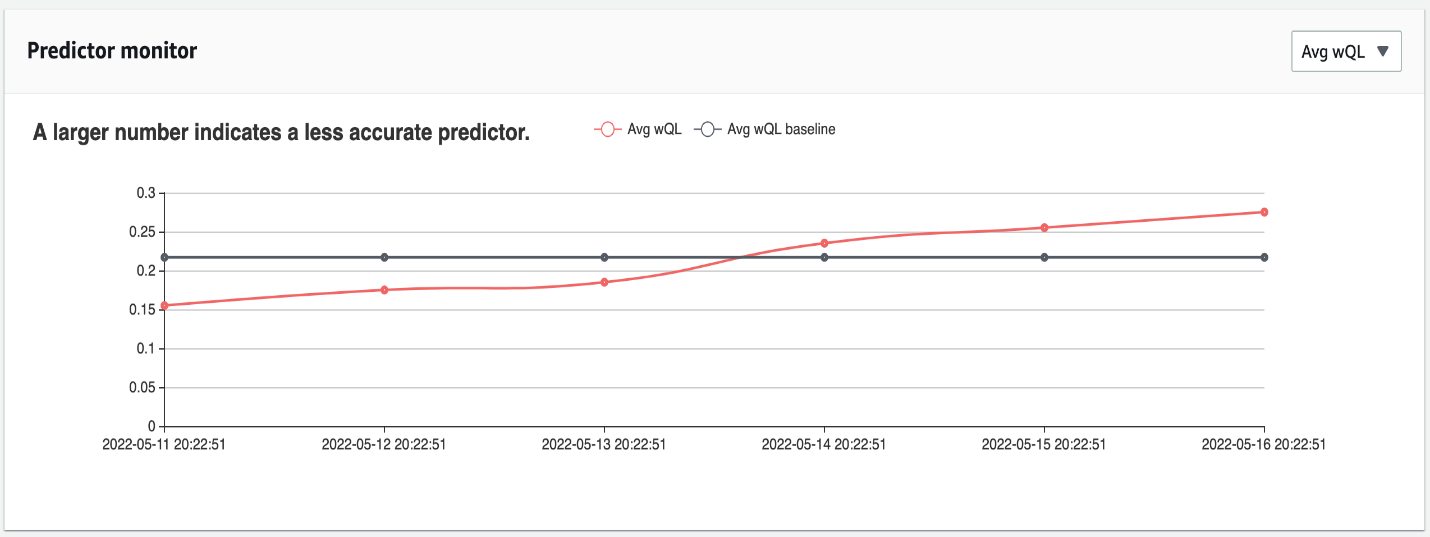
In the next figure, the opposite is true: the average wQL is increasing, indicating that accuracy is decreasing over time. In this case, you should consider retraining or rebuilding the predictor with new data.
In Forecast, you have the choice of retraining the current predictor or rebuilding it from scratch. Retraining is done with one click and incorporates more up-to-date data and any updates and improvements in the Forecast algorithms. Rebuilding the predictor allows you to provide new inputs (such as forecast frequency, horizon, or new dimension) to create a new predictor.
Enable predictor monitoring
You can enable predictor monitoring when creating a new predictor, or turn it on for existing predictors. The steps in this section demonstrate how to perform these steps using the Forecast console. There is also a Jupyter notebook that walks through a sequence of steps to enable predictor monitoring using APIs and generate predictor monitor results.
This example uses the time-sliced sample dataset available from the predictor monitoring notebook. In our example, we start with a 100,000-row dataset of New York City taxi pickups containing a timestamp, location ID, and target value (the number of pickups requested during the timestamp at the location ID).
Complete the following steps:
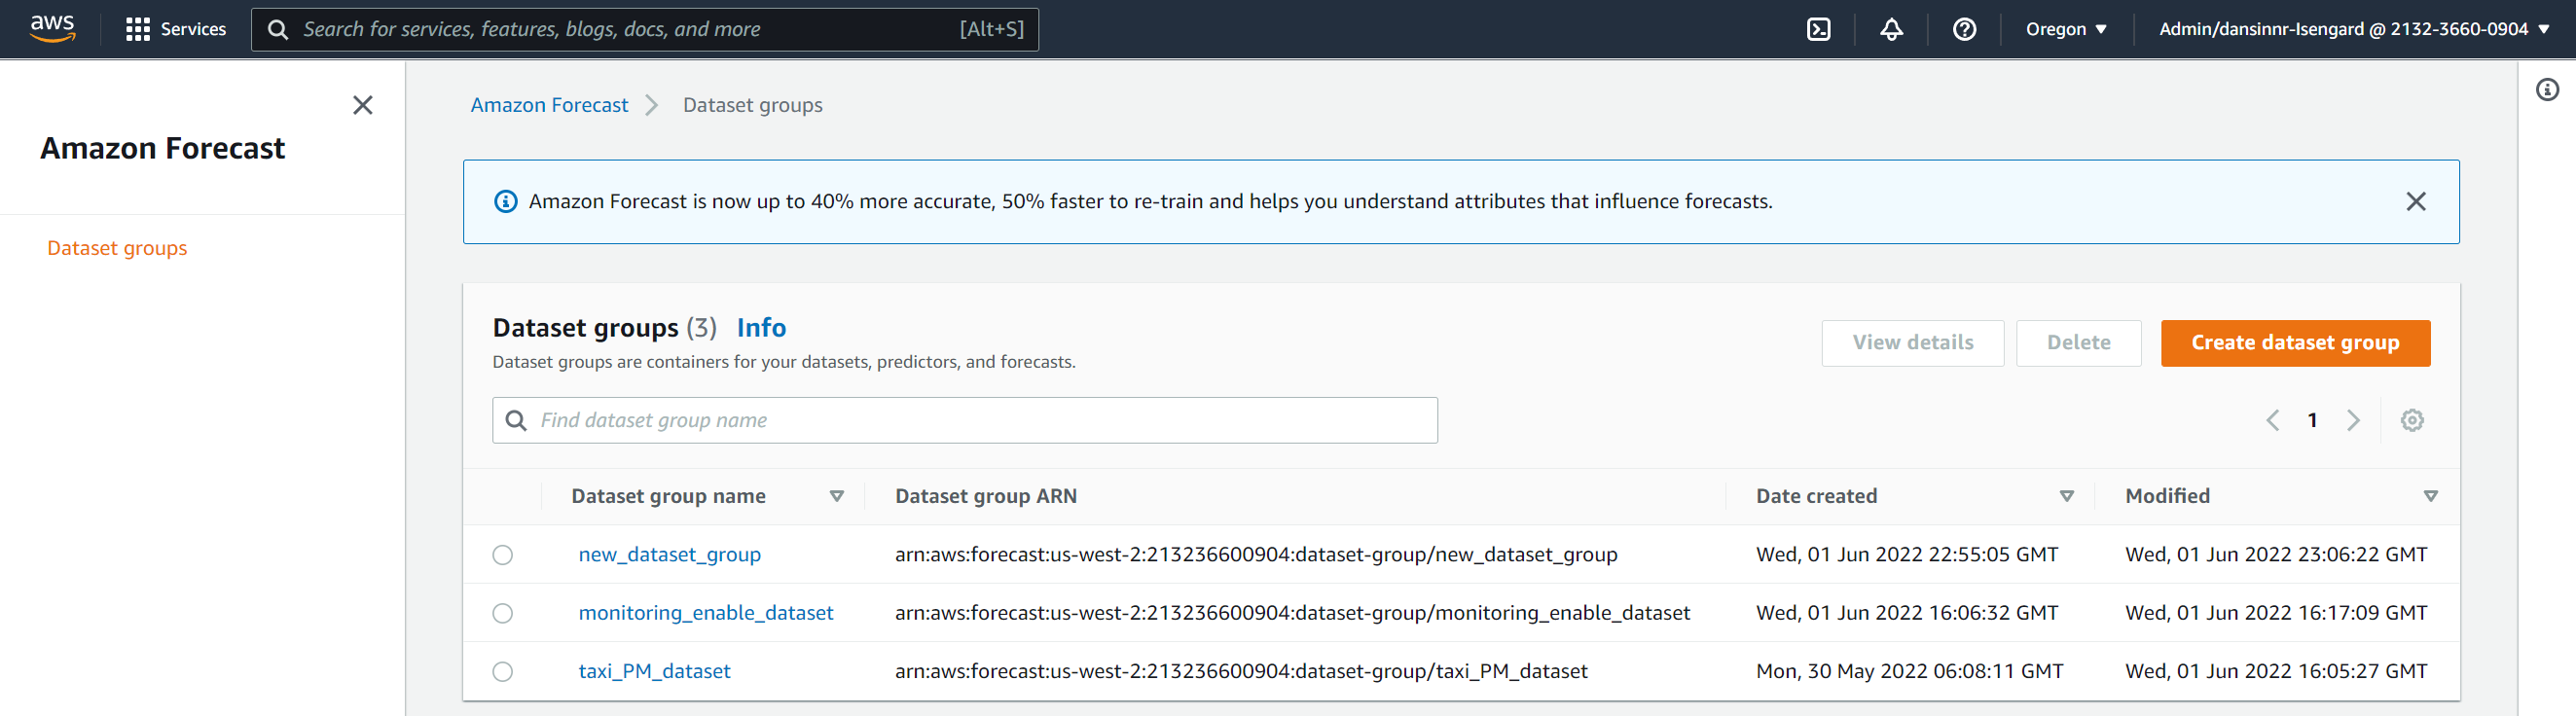
On the Forecast console, choose View dataset groups in the navigation pane.
Choose Create dataset group and provide your dataset group details.
After you create the dataset group, you’re prompted to create a target time series dataset. You use this dataset to train the predictor and create forecasts.
On the Create target time series dataset page, provide your data’s schema, frequency, and location.
Choose Start to import your target dataset.
Next, you build your predictor and train it using your initial dataset.
In the navigation pane, choose Predictors.
Choose Train new predictor.
In the Predictor settings section, enter a name for your predictor, how long in the future you want to forecast and at what frequency, and the number of quantiles you want to forecast for.
For Optimization metric, you can choose an optimization metric to optimize AutoPredictor to tune a model for a specific accuracy metric of your choice. We leave this as default for our walkthrough.
To get the predictor explainability report, select Enable predictor explainability.
To enable predictor monitoring, select Enable predictor monitoring.
Under the input data configuration, you can add local weather information and national holidays for more accurate demand forecasts.
Choose Start to start training your predictor.
Forecast now trains the predictor with this initial dataset. With predictor monitoring enabled, every time new data is provided in this dataset group, Forecast is able to compute updated predictor accuracy metrics.
After the predictor has been trained, choose it to evaluate the initial accuracy metrics.
The Metrics tab shows initial predictor quality metrics. Because you haven’t generated any forecasts from your predictor or imported any new ground truth data, there is nothing to show on the Monitoring tab.
The next step is to generate a forecast using the new predictor.
Choose Forecasts in the navigation pane.
Choose Create forecast to create a new forecast based on the time series data you just imported and the predictor settings.
Provide the forecast name, predictor name, and any additional quantile metrics you wish to compute.
After you create the forecast, you can view and export its details and results on the Forecast details page.
Predictor monitoring: Evaluating accuracy over time
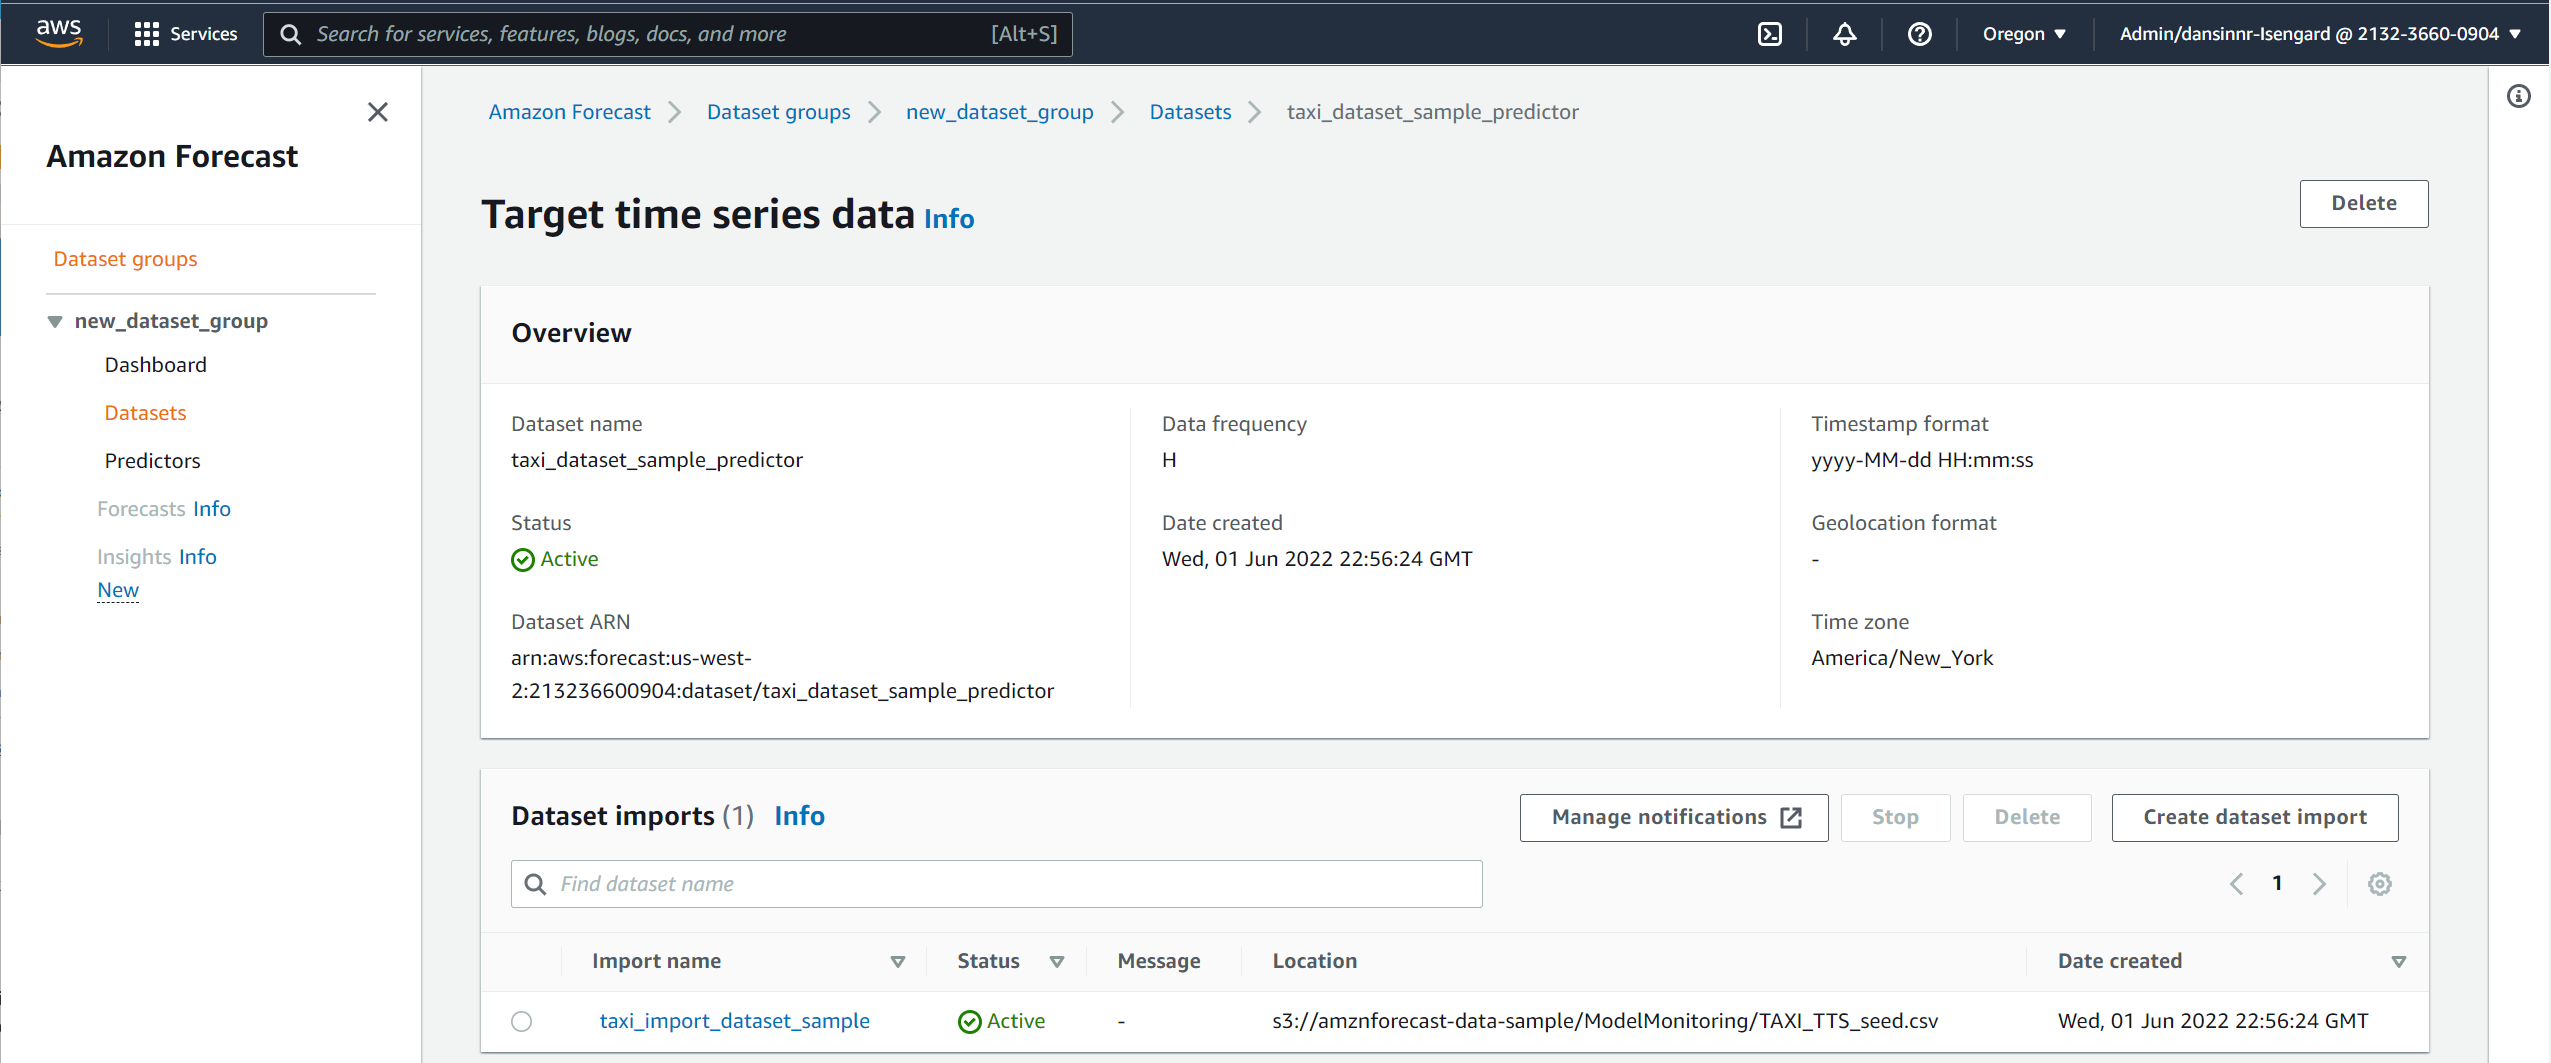
Through the passage of time, new ground truth data is created by your business processes, for example, updated sales figures, staffing levels, or manufacturing output. To create new forecasts based on that new data, you can import your data to the dataset you created.
On the Amazon Forecast console, on the Dataset groups page, choose your dataset group.
Choose your dataset.
In the Dataset imports section, choose Create dataset import.
Provide additional details about your updated data, including its location.
Choose Start.
With predictor monitoring, Forecast compares this new data to the previous forecast generated, and computes accuracy metrics for the predictor. Updated predictor quality metrics are computed on an ongoing basis as new data is added to the dataset.
You can follow these steps to import additional data, representing additional transactions that have occurred through time.
Evaluate predictor monitoring results
To see predictor monitoring results, you must add new ground truth data after generated the initial forecasts. Forecast compares this new ground truth data to the previous forecast, and produces updated model accuracy values for monitoring.
On the Dataset groups page, choose the relevant dataset groups and select the Target Time Series to update it with new ground truth data.
Choose Create Dataset Import and add your new ground truth data.
After you provide the additional ground truth data, you can open your predictor and view initial predictor monitoring statistics.
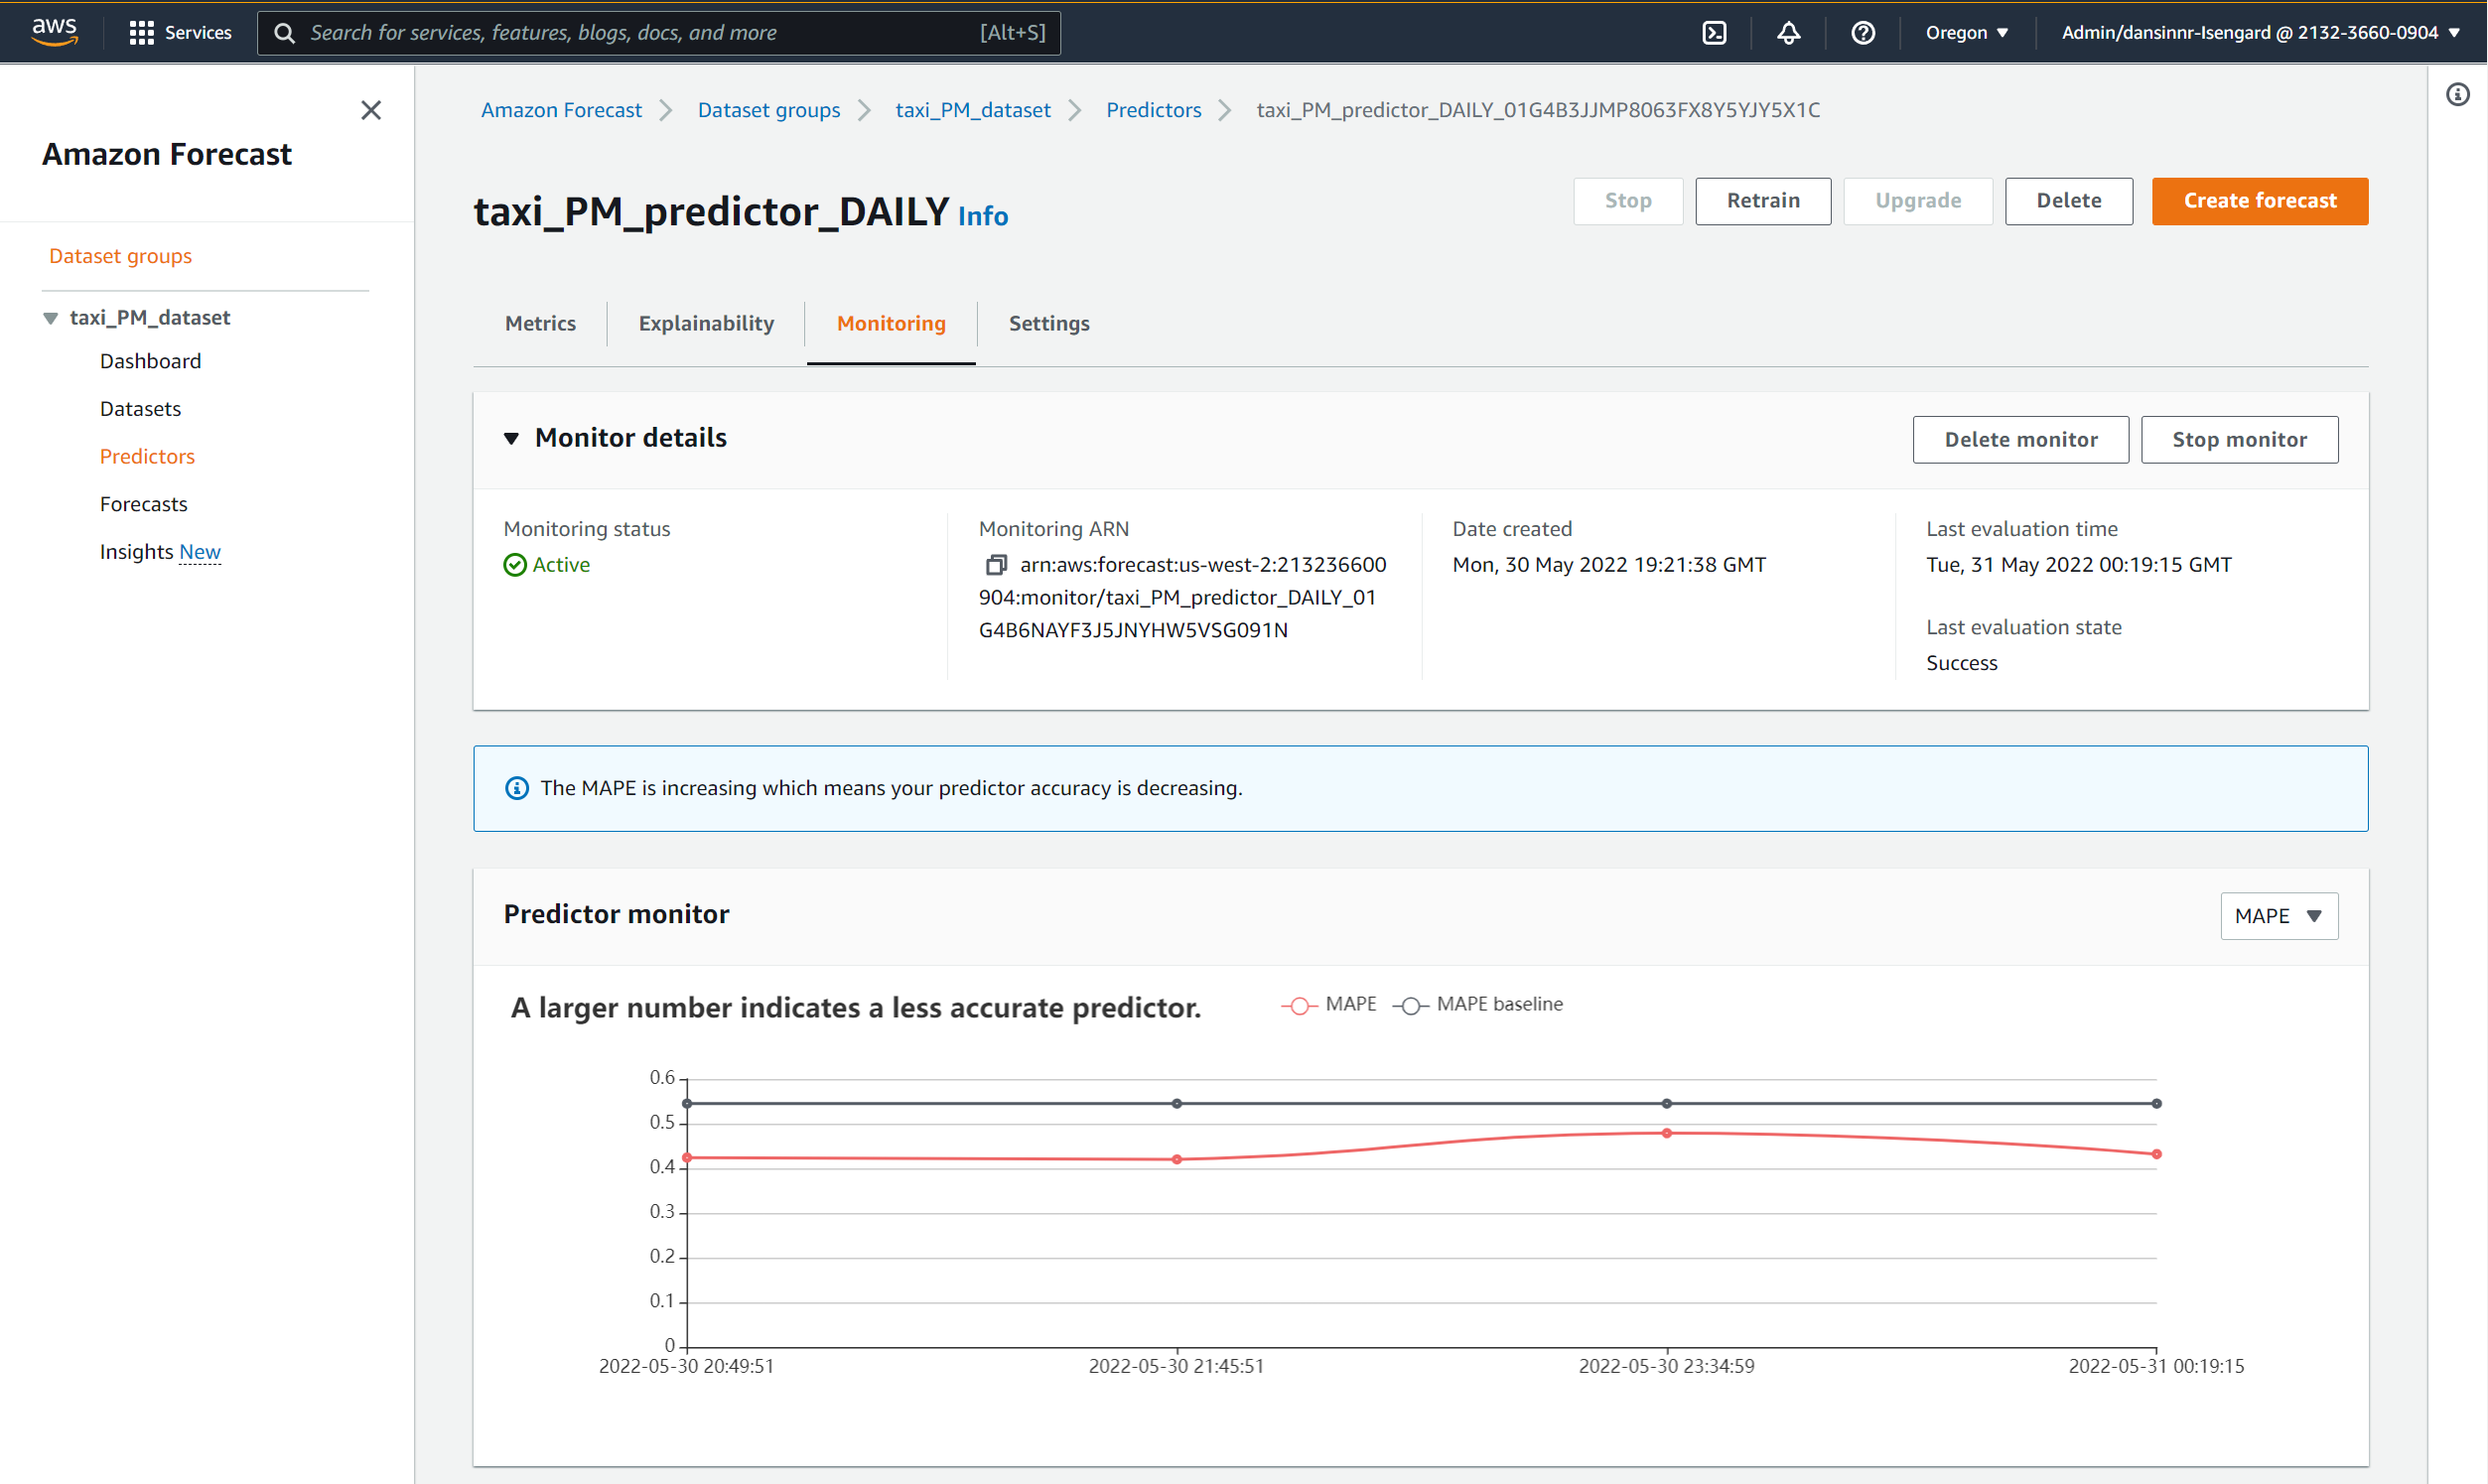
Choose your predictor and navigate to the Monitoring tab.
You can follow these steps to run additional forecasts using this predictor and add further iterations of ground truth data. The progression of model accuracy statistics for your predictor are available on the Monitoring tab.
This example shows model accuracy statistics for a predictor that has been evaluated with four additional data updates. The predictor had an initial baseline MAPE of 0.55 when it was initially trained. As additional data was loaded, the MAPE dropped to .42 with the first additional dataset, indicating a more accurate predictor, and fluctuated within a tight range from .42 to .48 with subsequent datasets.
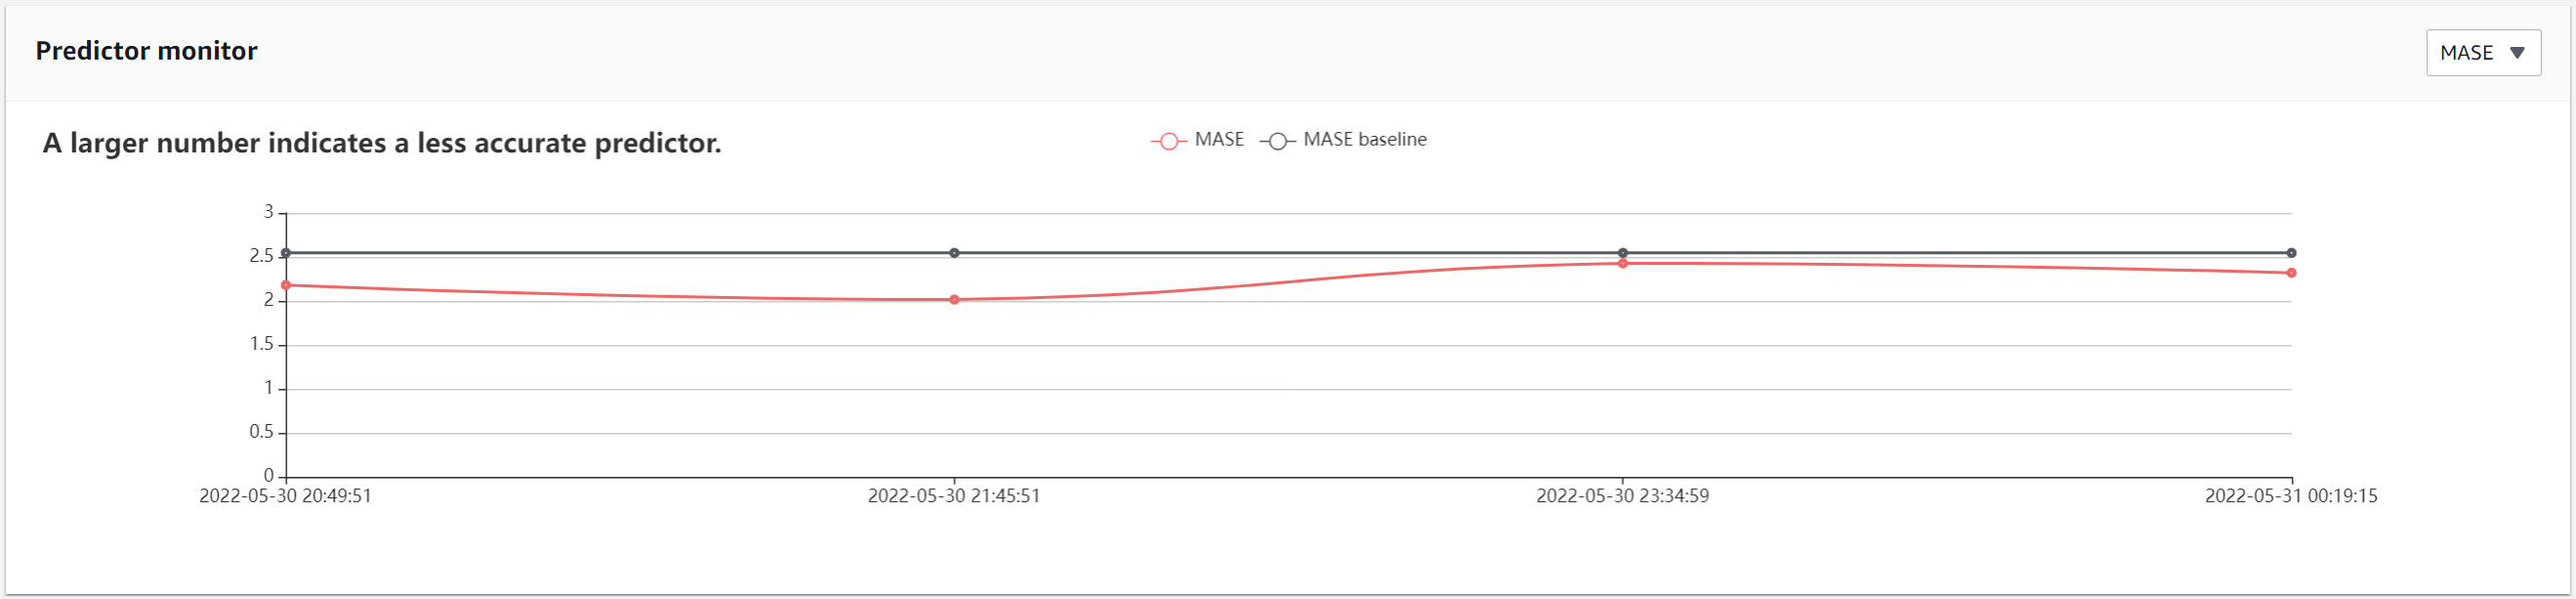
You can toggle the chart to view additional metrics. In the following examples, MASE and average wQL show similar fluctuations from the baseline over time.
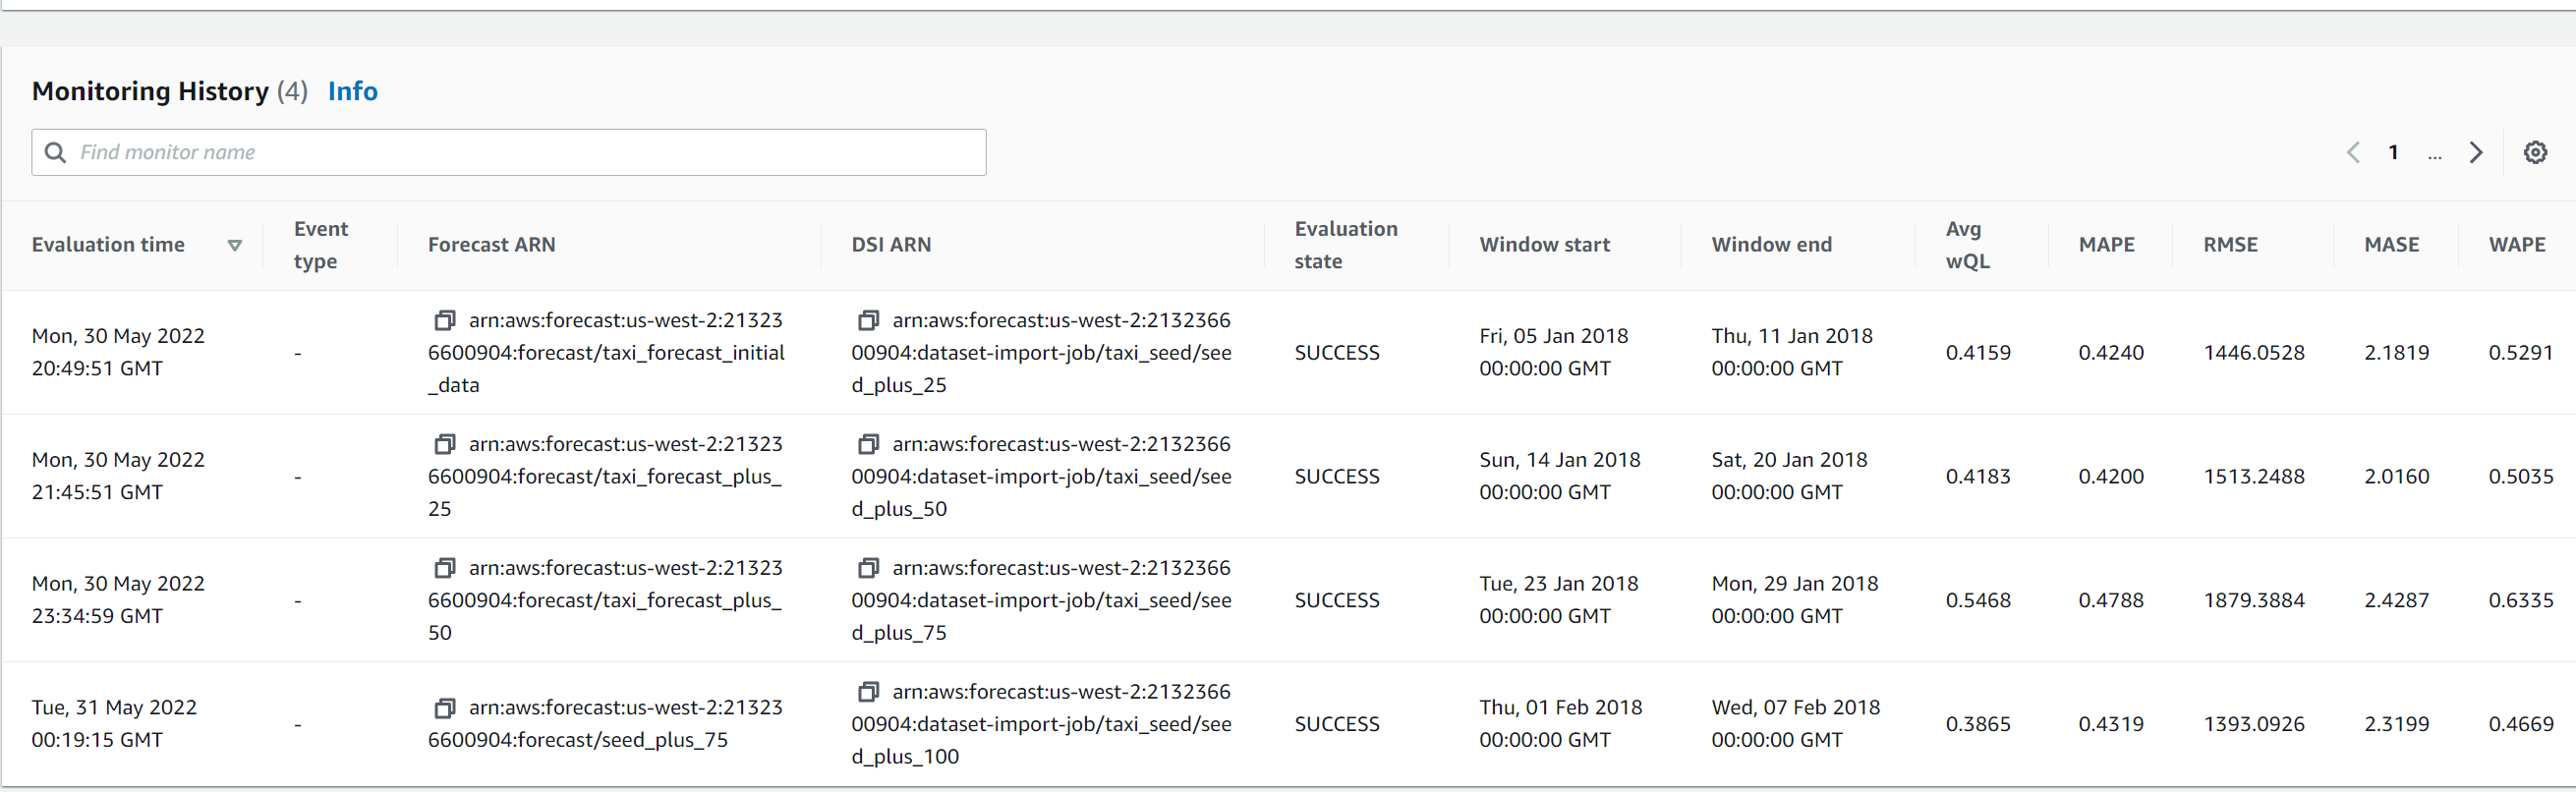
The Monitoring History section at the bottom of the page provides full details on all predictor accuracy metrics tracked over time.
Set up prediction monitoring on an existing predictor
You can easily enable monitoring for existing predictors. To do so, complete the following steps:
In the navigation pane, under your dataset, choose Predictors.
From here there are two ways to enable monitoring:
Choose Start monitoring under the Monitoring column.
Choose your predictor and on the Monitoring tab, under Monitor details, choose Start monitor.
In the pop-up dialog, choose Start to start monitoring for the selected predictor.
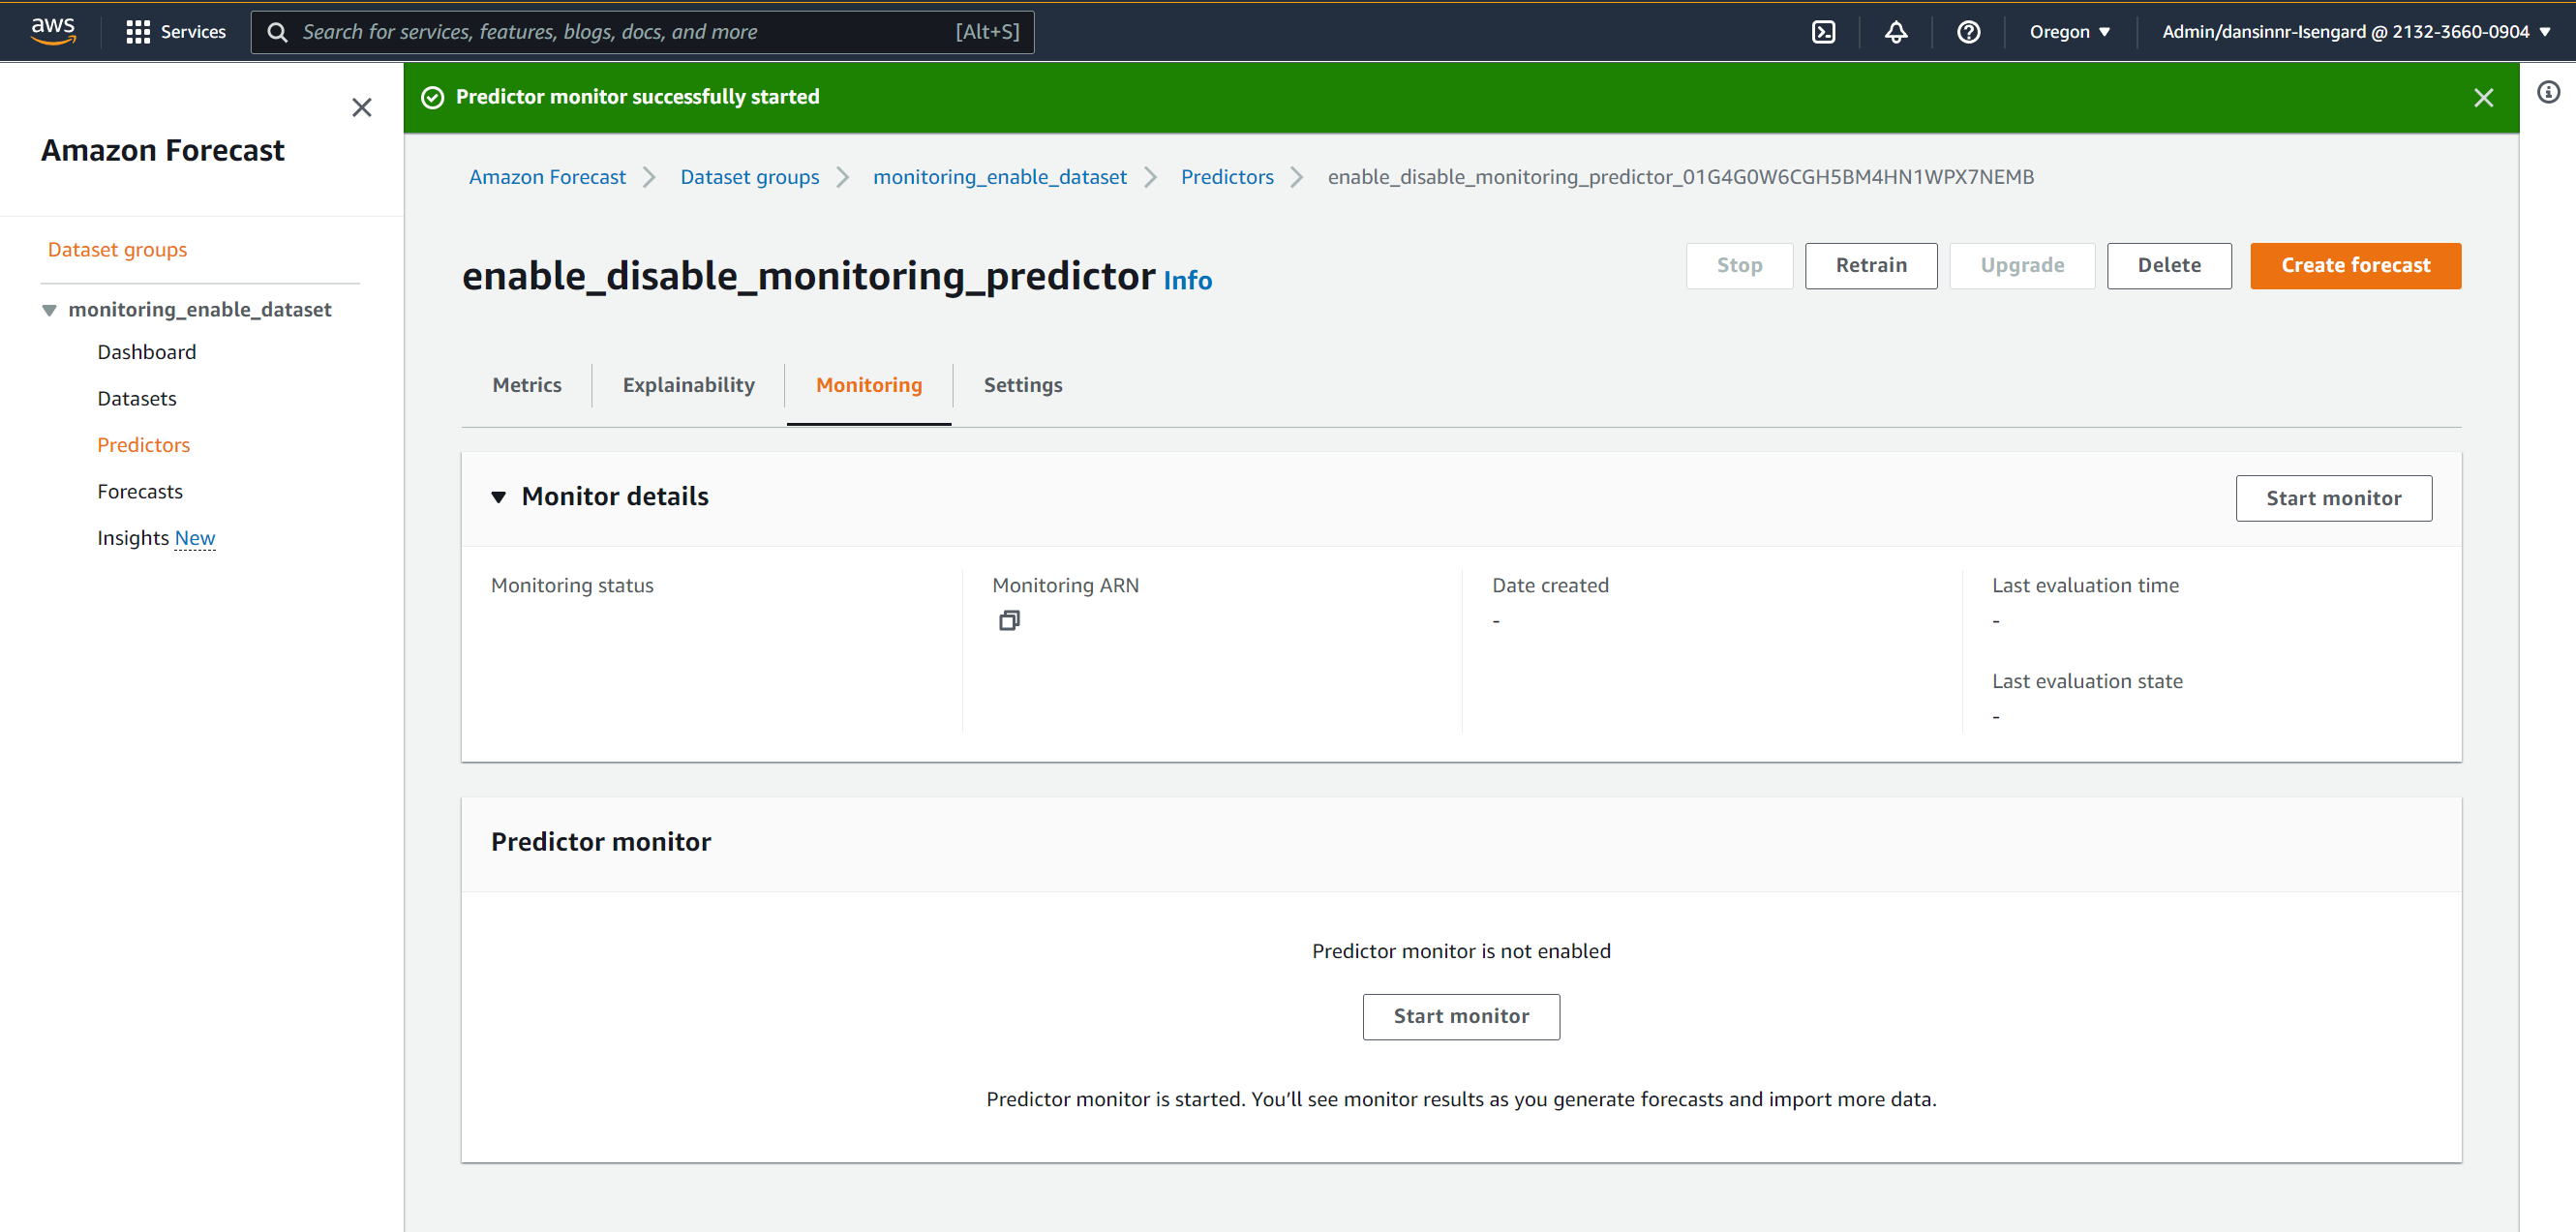
The Monitoring tab now shows that predictor monitoring has started, and results are generated as you import more data.
Stop and restart predictor monitoring
You can also stop and restart predictor monitoring. Consider the following:
Cost – Predictor monitoring consumes additional resources. With typical small datasets, the cost is minimal, but may increase with large datasets (number of items in the input dataset, and forecast horizon).
Privacy – A copy of your forecast is stored during monitoring. If you don’t want to store this copy, you can stop monitoring.
Noise – If you’re experimenting with a predictor and don’t want to see noise in your predictor monitor results, you can temporarily stop predictor monitoring and start it again when your predictor is stable again.
To stop predictor monitoring, complete the following steps:
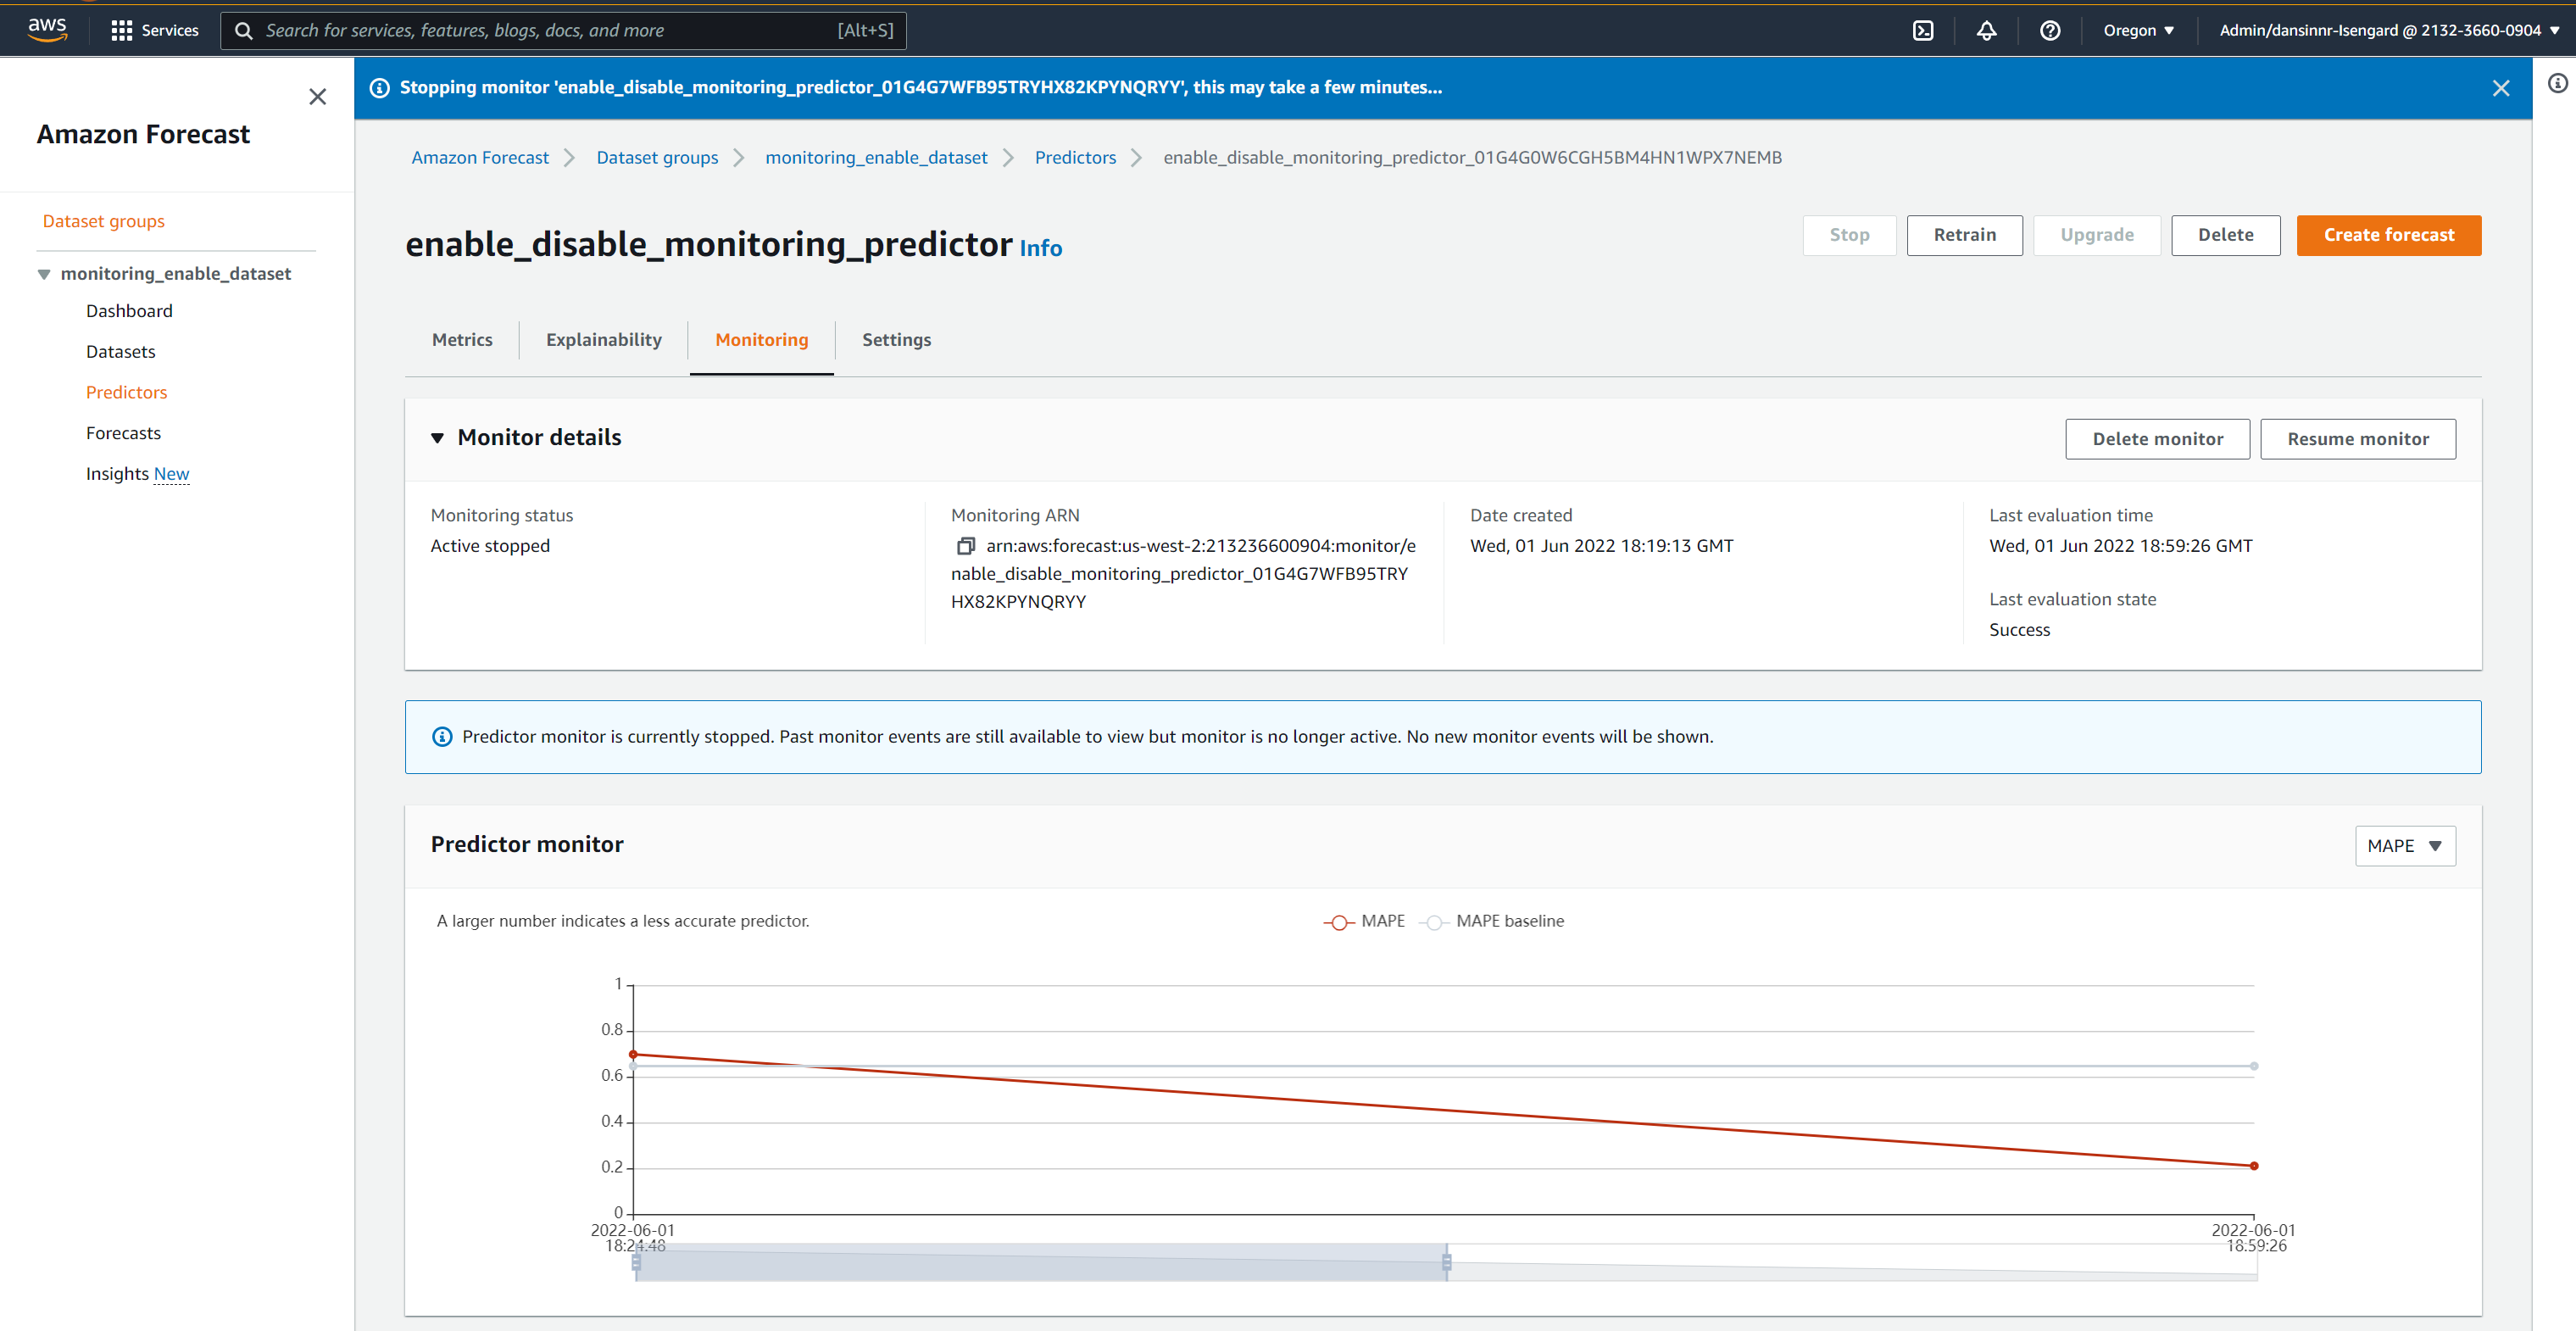
Navigate to the Monitoring tab for a predictor where monitoring is enabled.
Choose Stop Monitor to stop the monitoring of the predictor.
Verify your choice when prompted.
A message shows on the next page to indicate that predictor monitoring is stopped.
You can restart predictor monitoring by choosing Resume monitor.
Conclusion
Monitoring the quality of your predictors over time is important to achieve your demand planning and forecasting objectives, and ultimately your business goals. However, predictor monitoring can be a time-consuming exercise, and the processes required to stand up and maintain the necessary workflows can lead to higher operational costs.
Forecast can now automatically track the quality of your predictors, allowing you to reduce operational efforts, while helping you make more informed decisions about keeping, retraining, or rebuilding your predictors. To enable predictor monitoring, you can follow the steps outlined in this post, or follow our GitHub notebook.
Please note that predictor monitoring is only available with AutoPredictor. For more information, refer to New Amazon Forecast API that creates up to 40% more accurate forecasts and provides explainability and CreateAutoPredictor.
To learn more, refer to Predictor Monitoring. We also recommend reviewing the pricing for using these new features. All these new capabilities are available in all Regions where Forecast is publicly available. For more information about Region availability, see AWS Regional Services.
About the Authors
Dan Sinnreich is a Sr. Product Manager for Amazon Forecast. He is focused on democratizing low code/no code machine learning and applying it to improve business outcomes. Outside of work he can be found playing hockey, trying to improve his tennis serve, and reading science fiction.
Adarsh Singh works as a Software Development Engineer in the Amazon Forecast team. In his current role, he focuses on engineering problems and building scalable distributed systems that provide the most value to end users. In his spare time, he enjoys watching anime and playing video games.
Shannon Killingsworth is a UX Designer for Amazon Forecast. His current work is creating console experiences that are usable by anyone, and integrating new features into the console experience. In his spare time, he is a fitness and automobile enthusiast.
Read MoreAWS Machine Learning Blog