Editor’s Note: This post is part of our Next ’23 series sharing the latest Google Maps Platform news from the global exhibition of inspiration, innovation, and education. To learn more about our new products, join the What’s New with Google Maps Platform session tomorrow from 11 – 11:45 a.m. PDT.
According to the World Health Organization, up to ⅓ of the global population suffers from allergic rhinitis, with one quarter of adults in the US having seasonal allergies (roughly 67 million Americans). With the length of pollen seasons and severity of emissions worsening due to the rise in temperatures and greenhouse gas emissions as a result of the changing climate, businesses are looking to offer their audiences–especially pollen sensitive ones–value beyond just medication provision. To increase engagement levels with these customers and position their brands as a go-to resource for seasonal allergy sufferers, it’s becoming increasingly important for businesses to provide their users with reliable and actionable information on airborne pollen levels worldwide. Today we’re announcing our new Pollen API so businesses can share this relevant information with their users to help increase brand loyalty and engagement.
Our Pollen API can be used to help people limit the risks of exposure to allergenic pollen and make better informed daily decisions. It was created to support a variety of use cases with health-related benefits for your customers.
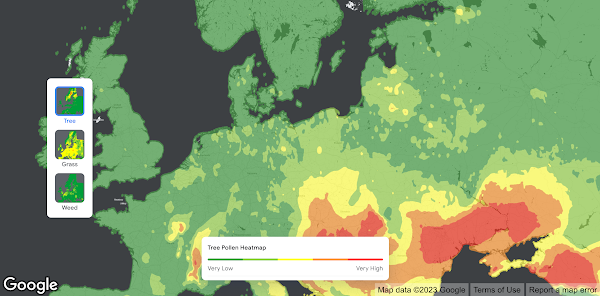
Relevant, localized pollen count dataHeatmap visualizationsDetailed plant allergen informationActionable tips to minimize pollen exposure
The data behind our Pollen API
Traditional pollen reporting is very manual, time-consuming, and often provides delayed results. Not to mention that for pollen sensitive people, it’s also important to have information about the specific plants and species they’re sensitive to. In order to provide useful, localized risk indicators to pollen-sensitive groups, it’s essential to distinguish between grass, weed, and tree pollen produced by various plant species. As pollen seasons continue to change and become harder to predict, traditional reporting of pollen counts are usually missing the information–especially at the local level–necessary to effectively assist people with their allergies.
Our Pollen API is based on a model that calculates the seasonality and daily amount of pollen grains on a 1×1 km2 grid in over 65 countries worldwide, supporting an up to 5-day forecast, 3 plant types, and 15 different plant species. The model uses various inputs like land cover, climatological data, annual pollen production per plant, and more to deliver reliable output predictions of the local pollen level and exposure risk.
Capabilities for healthier decision making and business growth
Providing personalized, location-based, plant-specific, timely pollen data is the key to engaging and educating impacted audiences. With our Pollen API, you can offer data-based insights for healthier decision making and support business growth opportunities such as:
Helping allergy sufferers minimize reactions by enabling them to optimize medication use, choose ideal times and cleanest routes for outdoor activities, and keep indoor spaces as pollen-free as possible. Empowering users to prepare for changes in pollen levels with useful pollen information through digital channels, like social, email, and website alerts. Creating interactive visual experiences that convey granular pollen information to help people make quicker, more informed health related decisions, increasing engagement and brand loyalty, and helping to differentiate your brand.
What pollen data can do for your business
Pollen data presents a unique opportunity for businesses–whether it’s an opportunity to build brand loyalty and trust, increase engagement and product value, or become a catalyst for a more resilient community. Tailored forecasts and dynamic environmental visualizations help people ‘see’ and understand the air around them, and take action accordingly. Such implementations of pollen data can enable business growth across a variety of industries:
For companies providing allergy services: personalized pollen data can be used to improve supply management and demand planning, inform market analysis, identify consumer trends to inform current and future product roadmaps.
For health or health-related businesses: By leveraging geolocal pollen data, you can deliver health-focused alerts and recommendations based on the specific needs and the environment of an individual allergy sufferer; for instance, alerts to take medication before increases in specific pollen counts are likely to occur or informing allergy sufferers when allergy risk is low so they can enjoy outdoor activities. This can lend itself to enhanced engagement with your product and brand.
For companion apps: Multiple-day pollen forecasts can be used to enhance offerings and open up new streams of monetization, by providing more long-term value to your users and enabling them to adopt healthier lifestyle habits like improved planning for daily and weekly travel, vacation and holiday trips, or even work purposes.
With the potential to significantly impact peoples’ lives, we’re excited to see the innovations created by integrating pollen data into various business models. The Pollen API is in Preview and currently available to existing Google Maps Platform customers. To get started, check out our Pollen API webpage. To learn more about our new suite of Environment APIs, join the What’s New with Google Maps Platform session tomorrow from 11 – 11:45 a.m. PDT.
Cloud BlogRead More


