

In data visualization world, look and feel of the dashboard is extremely important as it helps users to digest the insights you are showing in the dashboard. We generally style our dashboards with colorful charts and modern color palettes which are great ways to improve styling of the dashboard but tables are also important elements of the dashboard which requires makeover to make it appealing. In shiny apps, we have default table widget and other popular widgets like DT, reactable etc. Default look of these tables are not so impressive. In this post we will show you how you can style your basic html table with bootstrap 4 styles and classes.
I have created a user-defined function named tbl( ) for implementing bootstrap 4 classes with table. The function has four arguments which are as follows :
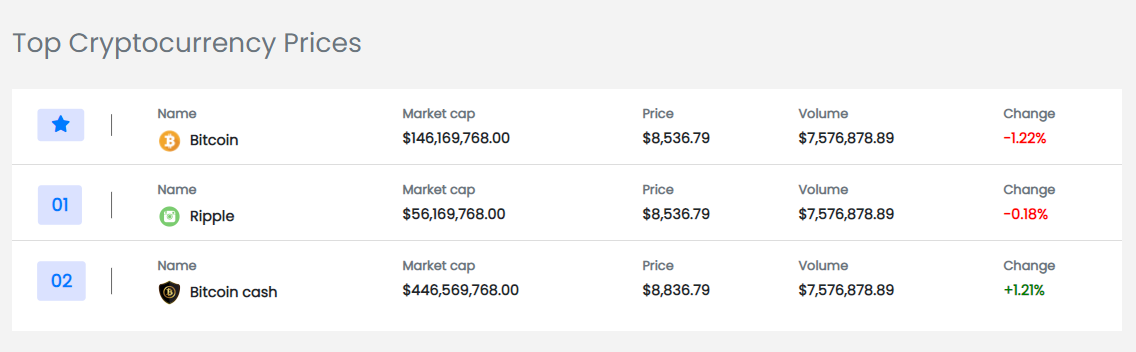
data Name of Data frame which you want to show in table. index Row Number. Will be displayed as first column in the table. You need to create a column for serial number. It can have any string or font awesome classes like fas fa-star. namecol Second column of the table. It can be any column wherein you want to show icons or images next to it. nameicon Optional Argument. Name of column which contains links of images.
df col0 = c(“fas fa-star”, “01”, “02”),
nameicon = c(“https://www.freepnglogos.com/uploads/bitcoin-png/bitcoin-all-about-bitcoins-9.png”,
“https://freepngimg.com/thumb/bitcoin/59549-cryptocurrency-money-bitcoin-gold-cash-free-photo-png-thumb.png”,
“https://freepngimg.com/thumb/bitcoin/59526-cryptocurrency-badge-bitcoin-gold-png-file-hd-thumb.png”),
Name = c(“Bitcoin”, “Ripple”, “Bitcoin cash”),
`Market cap` = c(“$146,169,768.00”, “$56,169,768.00”, “$446,569,768.00”),
Price = c(“$8,536.79”, “$8,536.79”, “$8,836.79”),
Volume = c(“$7,576,878.89”, “$7,576,878.89”, “$7,576,878.89”),
Change = c(“-1.22%”, “-0.18%”, “+1.21%”),
check.names = FALSE
)
In the program below we are using tbl(df, col0, Name, nameicon)
library(shiny)
library(dplyr)
tbl
temp index namecol
if(!missing(nameicon)) {
nameicon }
# Convert to Character
col_names data[,col_names]
# Loop over Rows
for(i in 1:nrow(data)) {
col0 = data[i,index]
col1 = data[i,namecol]
icon = data[i,nameicon]
first2cols
tags$td(tags$div(
class = “d-flex mt-2 border-right”,
tags$div(
class = “box p-2 rounded”,
tags$span(
class = ifelse(substr(col0,1,2)==”fa”, paste(col0, “fa-lg text-primary px-2”),
“text-primary px-2 font-weight-bold”),
ifelse(substr(col0,1,2)==”fa”, ”, col0)
)
)
)),
tags$td(tags$div(
class = “d-flex flex-column”,
tags$div(
class = “text-muted”,
namecol
),
if(!is.null(nameicon)) {
tags$div(
class = “d-flex align-items-center”,
tags$div(tags$img(
src = icon,
alt = NA,
class = “icons”
)),
tags$b(
class = “pl-2”,
col1
)
) } else {
tags$div(
tags$b(
col1
)
)
}
))
)
# Loop over Columns (ignoring index, name and icon columns)
temp.col data2 for(j in 1:ncol(data2)) {
temp.col[[j]] tags$td(tags$div(
class = “d-flex flex-column”,
tags$div(
class = “text-muted”,
colnames(data2)[j]
),
tags$div(tags$b(data2[i,j]))
))
}
temp[[i]]
}
tags$div(
class = “bg-white table-responsive”,
tags$table(
class = “table”,
tags$tbody(
temp
))
)
}
# Bootstrap 4
theme
# UI
ui
theme = theme,
br(),
htmltools::htmlDependency(name = “font-awesome”,
version = “5.13.0”,
src = “www/shared/fontawesome”,
package = “shiny”,
stylesheet = c(“css/all.min.css”, “css/v4-shims.min.css”)),
tags$style(“@import url(‘https://fonts.googleapis.com/css2?family=Poppins&display=swap’);
* {
padding: 0;
margin: 0;
box-sizing: border-box;
font-family: ‘Poppins’, sans-serif;
font-size: 0.95rem
}
body {
background-color: #f3f3f3
}
#starred {
box-shadow: 3px 3px 10px #b5b5b5
}
.table div.text-muted {
font-size: 0.85rem;
font-weight: 600;
margin-bottom: 0.3rem;
margin-top: 0.3rem
}
.icons {
object-fit: contain;
width: 25px;
height: 25px;
border-radius: 50%
}
.graph img {
object-fit: contain;
width: 40px;
height: 50px;
transform: scale(2) rotateY(45deg)
}
.graph .dot {
width: 12px;
height: 12px;
border-radius: 50%;
border: 3px solid #fff;
position: absolute;
background-color: blue;
box-shadow: 1px 1px 1px #a5a5a5;
top: 25px
}
.graph .dot:after {
background-color: #fff;
content: ‘$9,999.00’;
font-weight: 600;
font-size: 0.7rem;
position: absolute;
top: -25px;
left: -20px;
box-shadow: 1px 1px 2px #a5a5a5;
border-radius: 2px
}
.font-weight-bold {
font-size: 1.3rem
}
#ethereum {
transform: scale(2) rotateY(45deg) rotateX(180deg)
}
#ripple {
transform: scale(2) rotateY(10deg) rotateX(20deg)
}
#eos {
transform: scale(2) rotateY(50deg) rotateX(190deg)
}
.table tr td {
border: none
}
.red {
color: #ff2f2f;
font-weight: 700
}
.green {
color: #1cbb1c;
font-weight: 700
}
.labels,
.graph {
position: relative
}
.green-label {
background-color: #00b300;
color: #fff;
font-weight: 600;
font-size: 0.7rem
}
.orange-label {
background-color: #ffa500;
color: #fff;
font-weight: 600;
font-size: 0.7rem
}
.border-right {
transform: scale(0.6);
border-right: 1px solid black !important
}
.box {
transform: scale(1.5);
background-color: #dbe2ff
}
#top .table tbody tr {
border-bottom: 1px solid #ddd
}
#top .table tbody tr:last-child {
border: none
}
select {
background-color: inherit;
padding: 8px;
border-radius: 5px;
color: #444;
border: 1px solid #444;
outline-color: #00f
}
.text-white {
background-color: rgb(43, 159, 226);
border-radius: 50%;
font-size: 0.7rem;
font-weight: 700;
padding: 2px 3px
}
a:hover {
text-decoration: none
}
a:hover .text-white {
background-color: rgb(20, 92, 187)
}
::-webkit-scrollbar {
width: 10px;
height: 4px
}
::-webkit-scrollbar-thumb {
background: linear-gradient(45deg, #999, #777);
border-radius: 10px
}
@media(max-width:379px) {
.d-lg-flex .h3 {
font-size: 1.4rem
}
}
@media(max-width:352px) {
#plat {
margin-top: 10px
}
}”),
fluidRow(
tags$div(
class = “container mt-5”,
tags$div(
class = “d-lg-flex align-items-lg-center py-4”,
tags$div(
class = “h3 text-muted”,
“Top Cryptocurrency Prices”
)
),
tags$div(
id = “top”,
tbl(df, col0, Name, nameicon)
)
))
)
# Server
server
# Run App
shinyApp(ui = ui, server = server)
To color negative and positive signs in `change` column separately, we can use javascript for conditionally formatting. In the code below we are formatting 6th column td:nth-child(6). You can change it as per your dataframe.
jscode
$(‘table tbody td:nth-child(6) b’).each(function() {
const value = $(this).text().substr(0,1);
if ( value == ‘-‘) {
$(this).css(‘color’, ‘red’);
}
else {
$(this).css(‘color’, ‘green’);
}
});
clearInterval(CONTROL_INTERVAL2);
}, 500);”
See the complete code below
theme
# UI
ui
theme = theme,
br(),
htmltools::htmlDependency(name = “font-awesome”,
version = “5.13.0”,
src = “www/shared/fontawesome”,
package = “shiny”,
stylesheet = c(“css/all.min.css”, “css/v4-shims.min.css”)),
tags$script(“
Shiny.addCustomMessageHandler(‘closeWindow’, function(data) {
eval(data.message)
});”
),
tags$style(“@import url(‘https://fonts.googleapis.com/css2?family=Poppins&display=swap’);
* {
padding: 0;
margin: 0;
box-sizing: border-box;
font-family: ‘Poppins’, sans-serif;
font-size: 0.95rem
}
body {
background-color: #f3f3f3
}
#starred {
box-shadow: 3px 3px 10px #b5b5b5
}
.table div.text-muted {
font-size: 0.85rem;
font-weight: 600;
margin-bottom: 0.3rem;
margin-top: 0.3rem
}
.icons {
object-fit: contain;
width: 25px;
height: 25px;
border-radius: 50%
}
.graph img {
object-fit: contain;
width: 40px;
height: 50px;
transform: scale(2) rotateY(45deg)
}
.graph .dot {
width: 12px;
height: 12px;
border-radius: 50%;
border: 3px solid #fff;
position: absolute;
background-color: blue;
box-shadow: 1px 1px 1px #a5a5a5;
top: 25px
}
.graph .dot:after {
background-color: #fff;
content: ‘$9,999.00’;
font-weight: 600;
font-size: 0.7rem;
position: absolute;
top: -25px;
left: -20px;
box-shadow: 1px 1px 2px #a5a5a5;
border-radius: 2px
}
.font-weight-bold {
font-size: 1.3rem
}
#ethereum {
transform: scale(2) rotateY(45deg) rotateX(180deg)
}
#ripple {
transform: scale(2) rotateY(10deg) rotateX(20deg)
}
#eos {
transform: scale(2) rotateY(50deg) rotateX(190deg)
}
.table tr td {
border: none
}
.red {
color: #ff2f2f;
font-weight: 700
}
.green {
color: #1cbb1c;
font-weight: 700
}
.labels,
.graph {
position: relative
}
.green-label {
background-color: #00b300;
color: #fff;
font-weight: 600;
font-size: 0.7rem
}
.orange-label {
background-color: #ffa500;
color: #fff;
font-weight: 600;
font-size: 0.7rem
}
.border-right {
transform: scale(0.6);
border-right: 1px solid black !important
}
.box {
transform: scale(1.5);
background-color: #dbe2ff
}
#top .table tbody tr {
border-bottom: 1px solid #ddd
}
#top .table tbody tr:last-child {
border: none
}
select {
background-color: inherit;
padding: 8px;
border-radius: 5px;
color: #444;
border: 1px solid #444;
outline-color: #00f
}
.text-white {
background-color: rgb(43, 159, 226);
border-radius: 50%;
font-size: 0.7rem;
font-weight: 700;
padding: 2px 3px
}
a:hover {
text-decoration: none
}
a:hover .text-white {
background-color: rgb(20, 92, 187)
}
::-webkit-scrollbar {
width: 10px;
height: 4px
}
::-webkit-scrollbar-thumb {
background: linear-gradient(45deg, #999, #777);
border-radius: 10px
}
@media(max-width:379px) {
.d-lg-flex .h3 {
font-size: 1.4rem
}
}
@media(max-width:352px) {
#plat {
margin-top: 10px
}
}”),
fluidRow(
tags$div(
class = “container mt-5”,
tags$div(
class = “d-lg-flex align-items-lg-center py-4”,
tags$div(
class = “h3 text-muted”,
“Top Cryptocurrency Prices”
)
),
tags$div(
id = “top”,
tbl(df, col0, Name, nameicon)
)
))
)
# Server
server
session$sendCustomMessage(type = “closeWindow”, list(message = jscode))
}
# Run App
shinyApp(ui = ui, server = server)
Generally we need to pass reactive dataframe to table. Hence it is critical to run table in server section of the shiny app code. We can accomplish this using renderUI( ) and uiOutput( ) . See the demonstration below.
library(shiny)
library(dplyr)
df col0 = c(“fas fa-star”, “01”, “02”),
nameicon = c(“https://www.freepnglogos.com/uploads/bitcoin-png/bitcoin-all-about-bitcoins-9.png”,
“https://freepngimg.com/thumb/bitcoin/59549-cryptocurrency-money-bitcoin-gold-cash-free-photo-png-thumb.png”,
“https://freepngimg.com/thumb/bitcoin/59526-cryptocurrency-badge-bitcoin-gold-png-file-hd-thumb.png”),
Name = c(“Bitcoin”, “Ripple”, “Bitcoin cash”),
`Market cap` = c(“$146,169,768.00”, “$56,169,768.00”, “$446,569,768.00”),
Price = c(“$8,536.79”, “$8,536.79”, “$8,836.79”),
Volume = c(“$7,576,878.89”, “$7,576,878.89”, “$7,576,878.89”),
Change = c(“-1.22%”, “-0.18%”, “+1.21%”),
check.names = FALSE
)
jscode
$(‘#mytable table tbody td:nth-child(6) b’).each(function() {
const value = $(this).text().substr(0,1);
if ( value == ‘-‘) {
$(this).css(‘color’, ‘red’);
}
else {
$(this).css(‘color’, ‘green’);
}
});
clearInterval(CONTROL_INTERVAL2);
}, 500);”
tbl
temp index namecol
if(!missing(nameicon)) {
nameicon }
# Convert to Character
col_names data[,col_names]
# Loop over Rows
for(i in 1:nrow(data)) {
col0 = data[i,index]
col1 = data[i,namecol]
icon = data[i,nameicon]
first2cols
tags$td(tags$div(
class = “d-flex mt-2 border-right”,
tags$div(
class = “box p-2 rounded”,
tags$span(
class = ifelse(substr(col0,1,2)==”fa”, paste(col0, “fa-lg text-primary px-2”),
“text-primary px-2 font-weight-bold”),
ifelse(substr(col0,1,2)==”fa”, ”, col0)
)
)
)),
tags$td(tags$div(
class = “d-flex flex-column”,
tags$div(
class = “text-muted”,
namecol
),
if(!is.null(nameicon)) {
tags$div(
class = “d-flex align-items-center”,
tags$div(tags$img(
src = icon,
alt = NA,
class = “icons”
)),
tags$b(
class = “pl-2”,
col1
)
) } else {
tags$div(
tags$b(
col1
)
)
}
))
)
# Loop over Columns (ignoring index, name and icon columns)
temp.col data2 for(j in 1:ncol(data2)) {
temp.col[[j]] tags$td(tags$div(
class = “d-flex flex-column”,
tags$div(
class = “text-muted”,
colnames(data2)[j]
),
tags$div(tags$b(data2[i,j]))
))
}
temp[[i]]
}
tags$div(
class = “bg-white table-responsive”,
tags$table(
class = “table”,
tags$tbody(
temp
))
)
}
# Bootstrap 4
theme
# UI
ui
theme = theme,
br(),
htmltools::htmlDependency(name = “font-awesome”,
version = “5.13.0”,
src = “www/shared/fontawesome”,
package = “shiny”,
stylesheet = c(“css/all.min.css”, “css/v4-shims.min.css”)),
tags$script(“
Shiny.addCustomMessageHandler(‘closeWindow’, function(data) {
eval(data.message)
});”
),
tags$style(“@import url(‘https://fonts.googleapis.com/css2?family=Poppins&display=swap’);
* {
padding: 0;
margin: 0;
box-sizing: border-box;
font-family: ‘Poppins’, sans-serif;
font-size: 0.95rem
}
body {
background-color: #f3f3f3
}
#starred {
box-shadow: 3px 3px 10px #b5b5b5
}
.table div.text-muted {
font-size: 0.85rem;
font-weight: 600;
margin-bottom: 0.3rem;
margin-top: 0.3rem
}
.icons {
object-fit: contain;
width: 25px;
height: 25px;
border-radius: 50%
}
.graph img {
object-fit: contain;
width: 40px;
height: 50px;
transform: scale(2) rotateY(45deg)
}
.graph .dot {
width: 12px;
height: 12px;
border-radius: 50%;
border: 3px solid #fff;
position: absolute;
background-color: blue;
box-shadow: 1px 1px 1px #a5a5a5;
top: 25px
}
.graph .dot:after {
background-color: #fff;
content: ‘$9,999.00’;
font-weight: 600;
font-size: 0.7rem;
position: absolute;
top: -25px;
left: -20px;
box-shadow: 1px 1px 2px #a5a5a5;
border-radius: 2px
}
.font-weight-bold {
font-size: 1.3rem
}
#ethereum {
transform: scale(2) rotateY(45deg) rotateX(180deg)
}
#ripple {
transform: scale(2) rotateY(10deg) rotateX(20deg)
}
#eos {
transform: scale(2) rotateY(50deg) rotateX(190deg)
}
.table tr td {
border: none
}
.red {
color: #ff2f2f;
font-weight: 700
}
.green {
color: #1cbb1c;
font-weight: 700
}
.labels,
.graph {
position: relative
}
.green-label {
background-color: #00b300;
color: #fff;
font-weight: 600;
font-size: 0.7rem
}
.orange-label {
background-color: #ffa500;
color: #fff;
font-weight: 600;
font-size: 0.7rem
}
.border-right {
transform: scale(0.6);
border-right: 1px solid black !important
}
.box {
transform: scale(1.5);
background-color: #dbe2ff
}
#top .table tbody tr {
border-bottom: 1px solid #ddd
}
#top .table tbody tr:last-child {
border: none
}
select {
background-color: inherit;
padding: 8px;
border-radius: 5px;
color: #444;
border: 1px solid #444;
outline-color: #00f
}
.text-white {
background-color: rgb(43, 159, 226);
border-radius: 50%;
font-size: 0.7rem;
font-weight: 700;
padding: 2px 3px
}
a:hover {
text-decoration: none
}
a:hover .text-white {
background-color: rgb(20, 92, 187)
}
::-webkit-scrollbar {
width: 10px;
height: 4px
}
::-webkit-scrollbar-thumb {
background: linear-gradient(45deg, #999, #777);
border-radius: 10px
}
@media(max-width:379px) {
.d-lg-flex .h3 {
font-size: 1.4rem
}
}
@media(max-width:352px) {
#plat {
margin-top: 10px
}
}”),
fluidRow(
tags$div(
class = “container mt-5”,
tags$div(
class = “d-lg-flex align-items-lg-center py-4”,
tags$div(
class = “h3 text-muted”,
“Top Cryptocurrency Prices”
)
),
tags$div(
id = “top”,
uiOutput(‘mytable’)
)
))
)
# Server
server
output$mytable
tbl(df, col0, Name, nameicon)
})
session$sendCustomMessage(type = “closeWindow”, list(message = jscode))
}
# Run App
shinyApp(ui = ui, server = server)
Read MoreListenData