

Many of our customers running SQL Server on Amazon Elastic Compute Cloud (Amazon EC2) instances want to capture specific events (systems and user-defined) for monitoring and troubleshooting issues with SQL Server. SQL Server logs these events in its error logs and agent logs.
A deadlock is an event that can be captured in SQL Server error logs, and you may often want to be notified of these events. A deadlock occurs when two or more processes are waiting on the same resource and each process is waiting on the other process to complete before moving forward. When this situation occurs, there is no way for these processes to resolve the conflict, so SQL Server automatically chooses one of the processes as the victim of the deadlock and rolls back the process, and the other process succeeds.
Although the client application may see and handle deadlocks, these are not captured in SQL Server error logs by default.
The error message that SQL Server sends back to the client is similar to the following:
With SQL Server on Amazon EC2, you can now monitor deadlocks and send Amazon Simple Notification Service (Amazon SNS) notifications as soon as a deadlock event occurs for a SQL Server instance. This can help you automate deadlock reporting and take appropriate actions to resolve deadlock conflicts.
This solution isn’t limited to capturing deadlock events; you can scale this solution to monitor other system and user-defined events captured in the error logs and SQL Server agent logs.
In this post, we show you how to publish error and agent log events directly to Amazon CloudWatch Logs and set up CloudWatch alarms and SNS notifications for the deadlock events that match the filter pattern that you create.
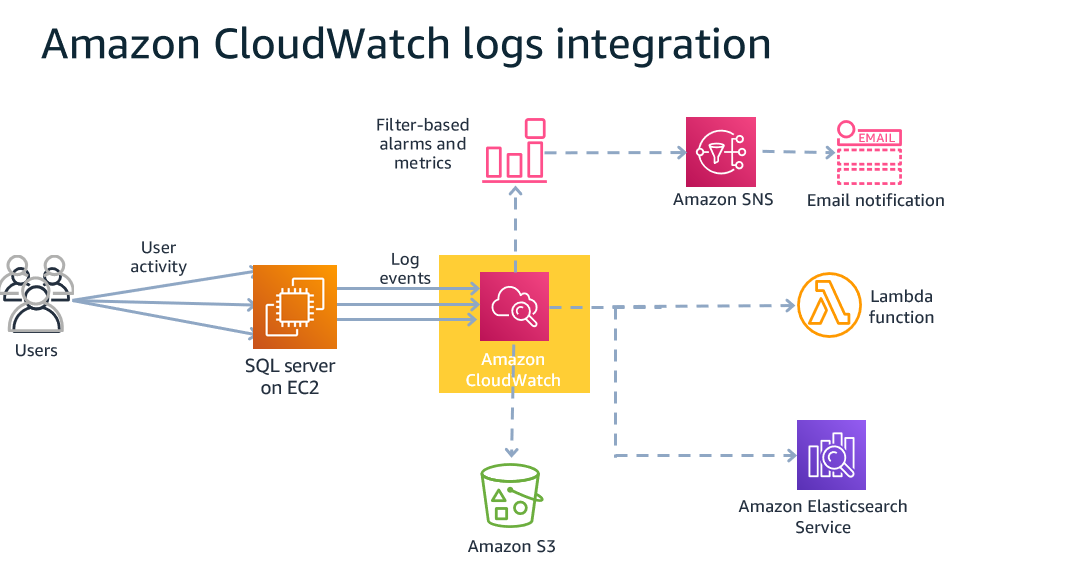
Solution overview
The following diagram illustrates the solution architecture for CloudWatch integration with SQL Server.
To implement the solution, we walk through the following high-level steps:
Enable deadlock detection for SQL Server.
Publish SQL Server error logs to CloudWatch.
Simulate a deadlock event.
Create a filter pattern and CloudWatch alarm.
Prerequisites
Before you get started, you must have the following prerequisites:
Access to the AWS Management Console and CloudWatch
An email address to receive notifications
SQL Server Management Studio (SSMS)
An EC2 instance with SQL Server on Windows Server
Enable deadlock detection for SQL Server
To enable deadlock detection in SQL Server, you must enable global trace flags 1222 and 1204. There are two ways to enable global trace flags:
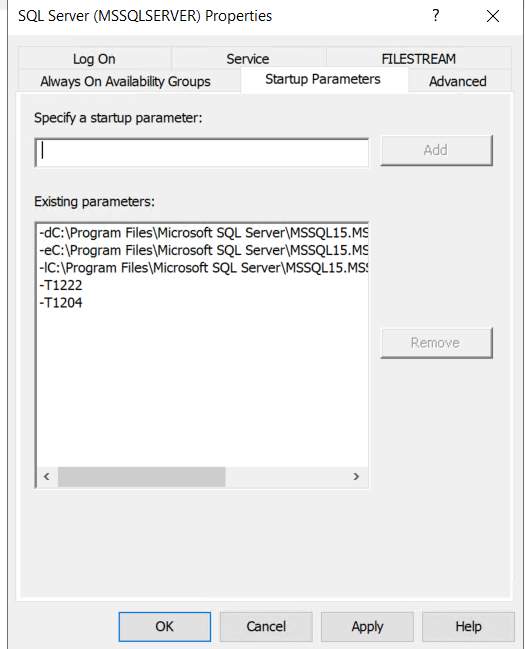
Method 1 – Enable deadlock detection by setting –T1222 and –T1204 startup options in SQL Server properties as shown in the following screenshot. We recommend this option because it helps persist deadlock detection across SQL Server or Windows restarts.
You need to restart SQL Server for these startup options to take effect. Alternately, you can follow Method 2 to avoid a restart.
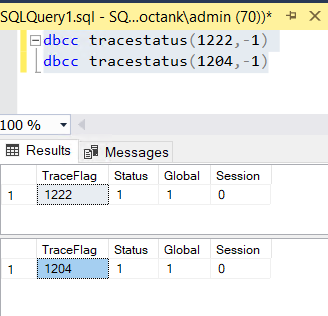
Method 2 – You can enable using the DBCC Traceon(1222,-1) and DBCC Traceon(1204,-1) command. The -1 parameter in the DBCC TRACEON command indicates to SQL Server that this trace flag should be set globally.
You can check the status of the trace flag using the DBCC TRACESTATUS (1222, -1) and DBCC TRACESTATUS(1204,-1) command.
Publish the SQL Server error logs to CloudWatch
To publish your SQL Server error logs to CloudWatch, complete the following steps:
Install the CloudWatch agent on your EC2 Windows instance.
Create the CloudWatch agent configuration file and specify the SQL Server error log file as a customer log to monitor during the configuration. Configure the CloudWatch agent file at C:Program FilesAmazonAmazonCloudWatchAgent.
To start the CloudWatch agent on the EC2 Windows instance, run Windows PowerShell with administrator rights and run the following command:
Verify the status of the CloudWatch agent on your EC2 Windows instance:
Now that the service has started, it starts sending logs to CloudWatch Logs. It takes a few minutes before the first data appears.
You can open the CloudWatch Console in the Region specified to find the new log groups created.
Simulate a deadlock event
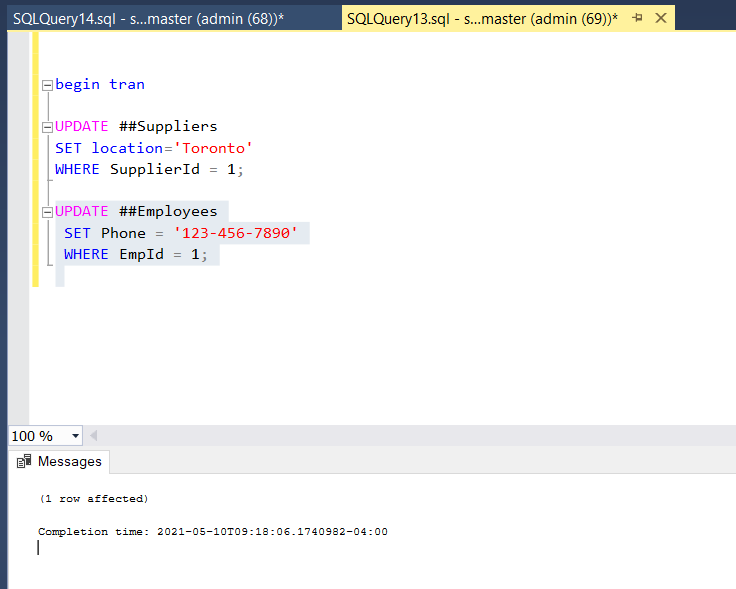
Simulate a deadlock transaction on your SQL Server instance by running the following T-SQL code in SSMS:
Next, open two query windows in SSMS and run the following code in each of the sessions. Run the commands on row by row fashion, each session on its own window.
Session 1
Session 2
After you run the code, one of the transactions is processed.
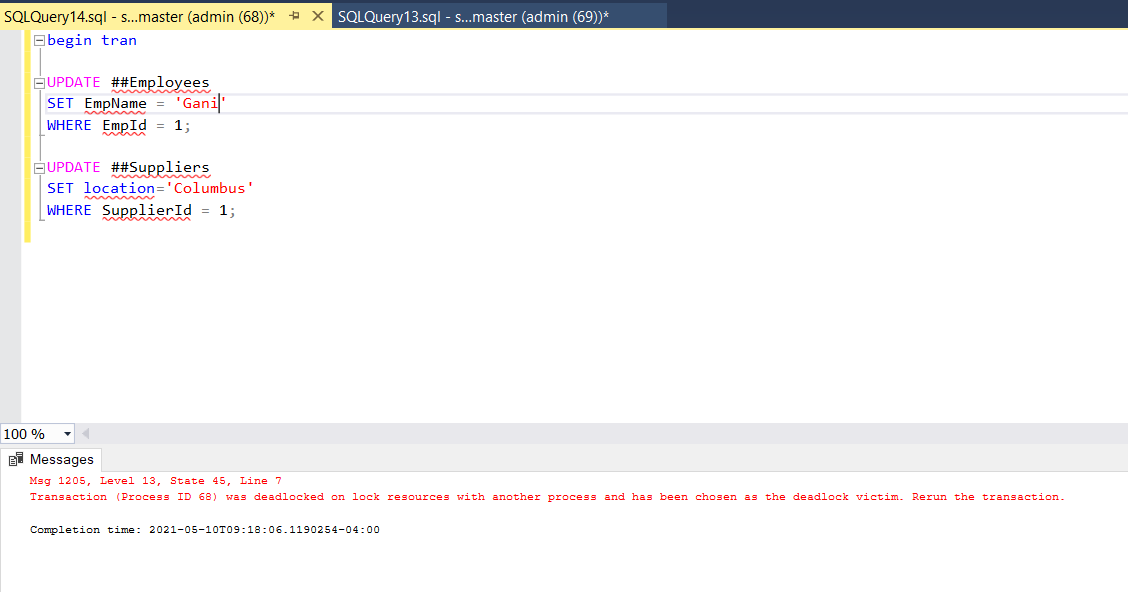
The following screenshot shows that the second transaction is blocked with a deadlock error.
Create a filter pattern and CloudWatch alarm
You can create a filter for specific errors you want to monitor.
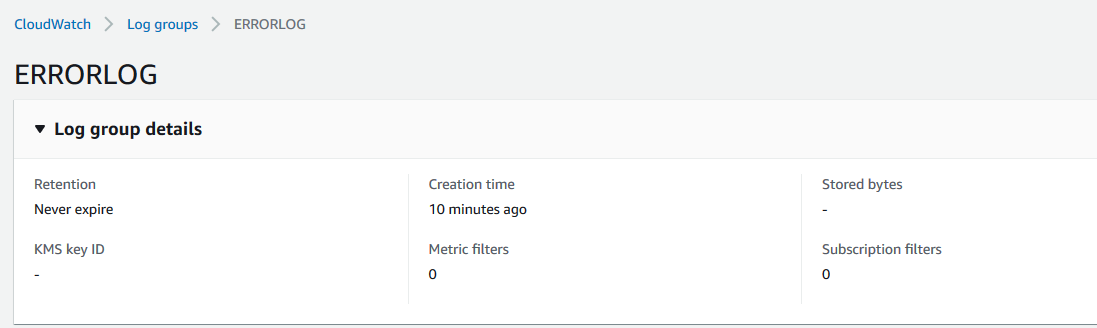
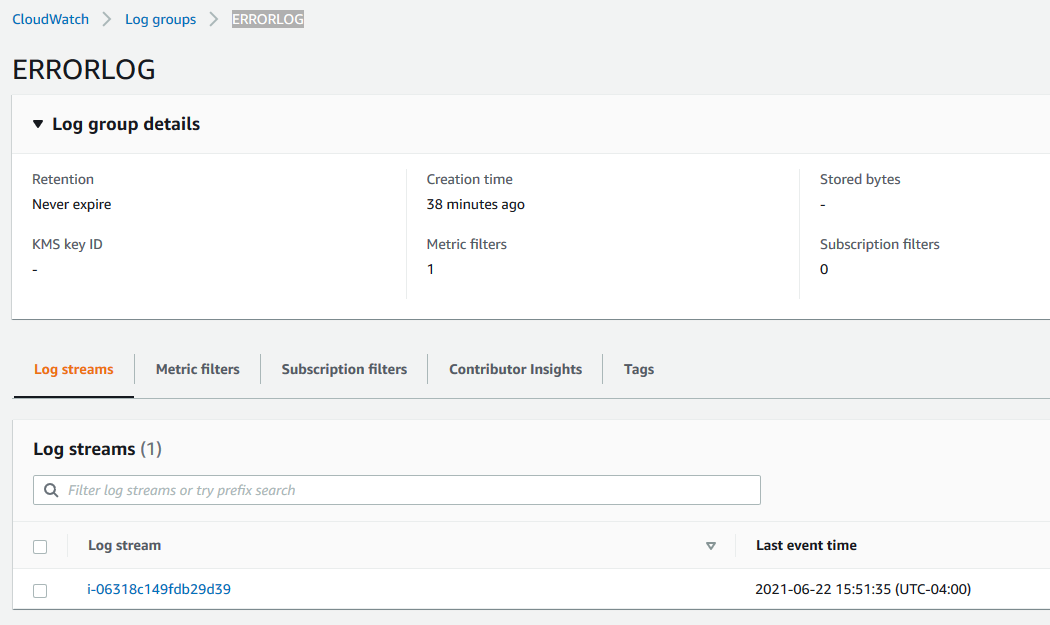
On the CloudWatch console, under Logs, choose Log groups.
Choose the SQL Server error logs of your SQL Server DB instance.
The logs are listed in ERRORLOG.
On the Metric filters tab, choose Create metric filter.
In the Filter Pattern section, enter deadlock.
Select any errors to monitor and use that as the filter word.
Choose Assign metric.
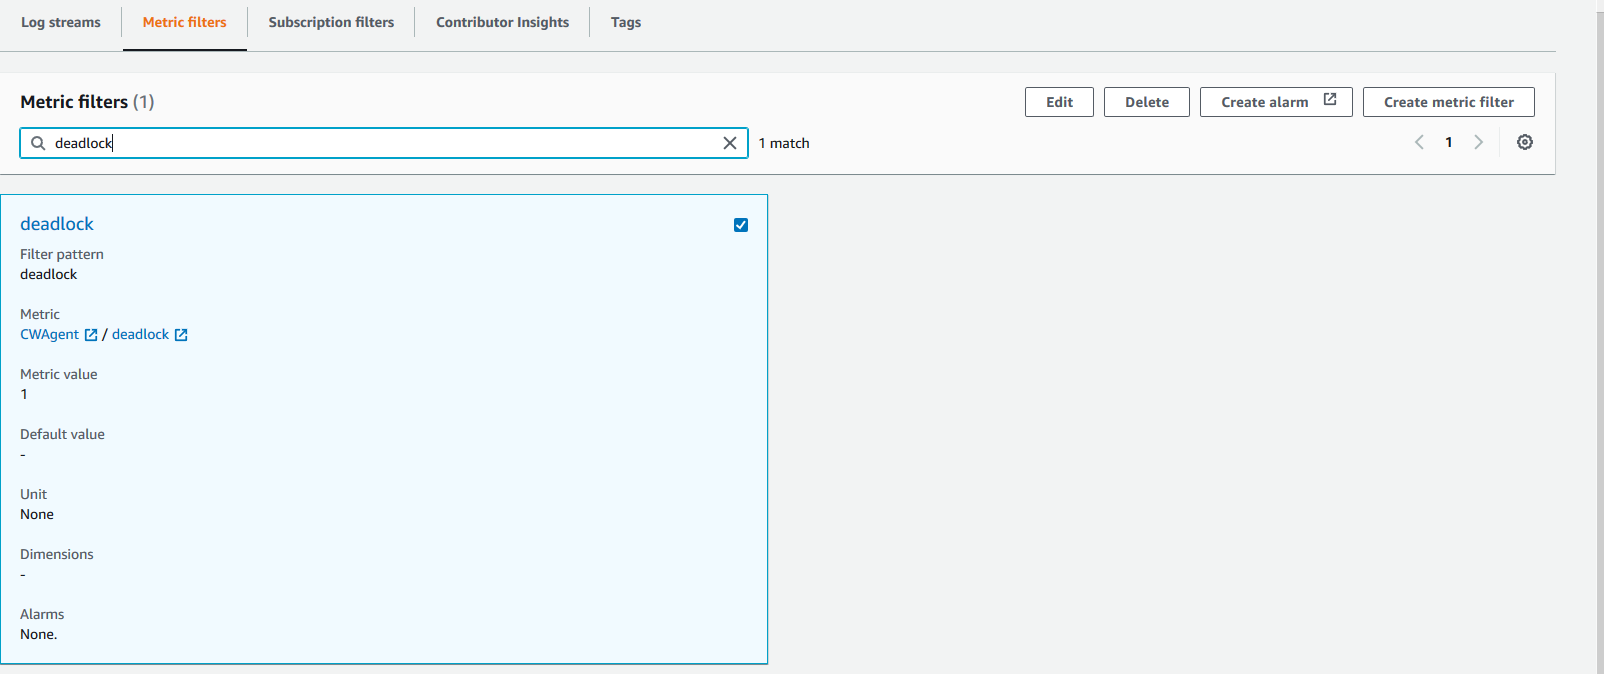
Enter deadlock in both the Filter Name and Metric Name fields.
Set the metric value field to 1.
Choose Create Filter.
The following screenshot shows your filter details.
After the deadlock filter is created, choose Create alarm.
On the Specify metric and conditions page, for Metric name, enter deadlock.
For Statistic, choose Minimum.
For Period, choose the time period for the alarm, for example, 1 minute.
In the Conditions section, for Threshold type, choose Static.
For Whenever Deadlock is, choose Greater > threshold.
For Than, enter 0.
Choose Next.
In the Notification section, for Alarm state trigger, choose In alarm.
Select an SNS topic, or choose Create new topic to create an SNS topic using the email address you want to receive alerts.
Choose Next.
In the Name and description section, enter a name and description for your alarm.
Choose Next.
On the Preview and create page, review your alarm configuration, then choose Create alarm.
Confirm the notification email.
You can check the alarm’s status. When the alarm has enough data, the status shows as OK.
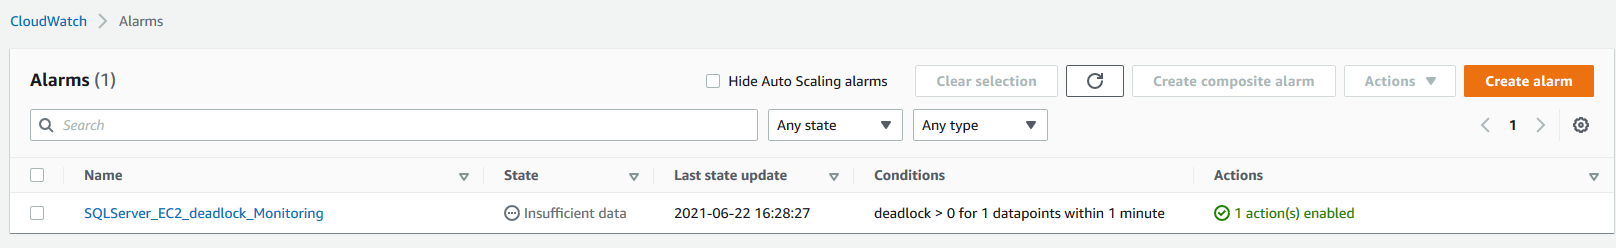
After you follow these steps, simulate a deadlock again. The CloudWatch alarm sends an SNS notification to the email that you specified.
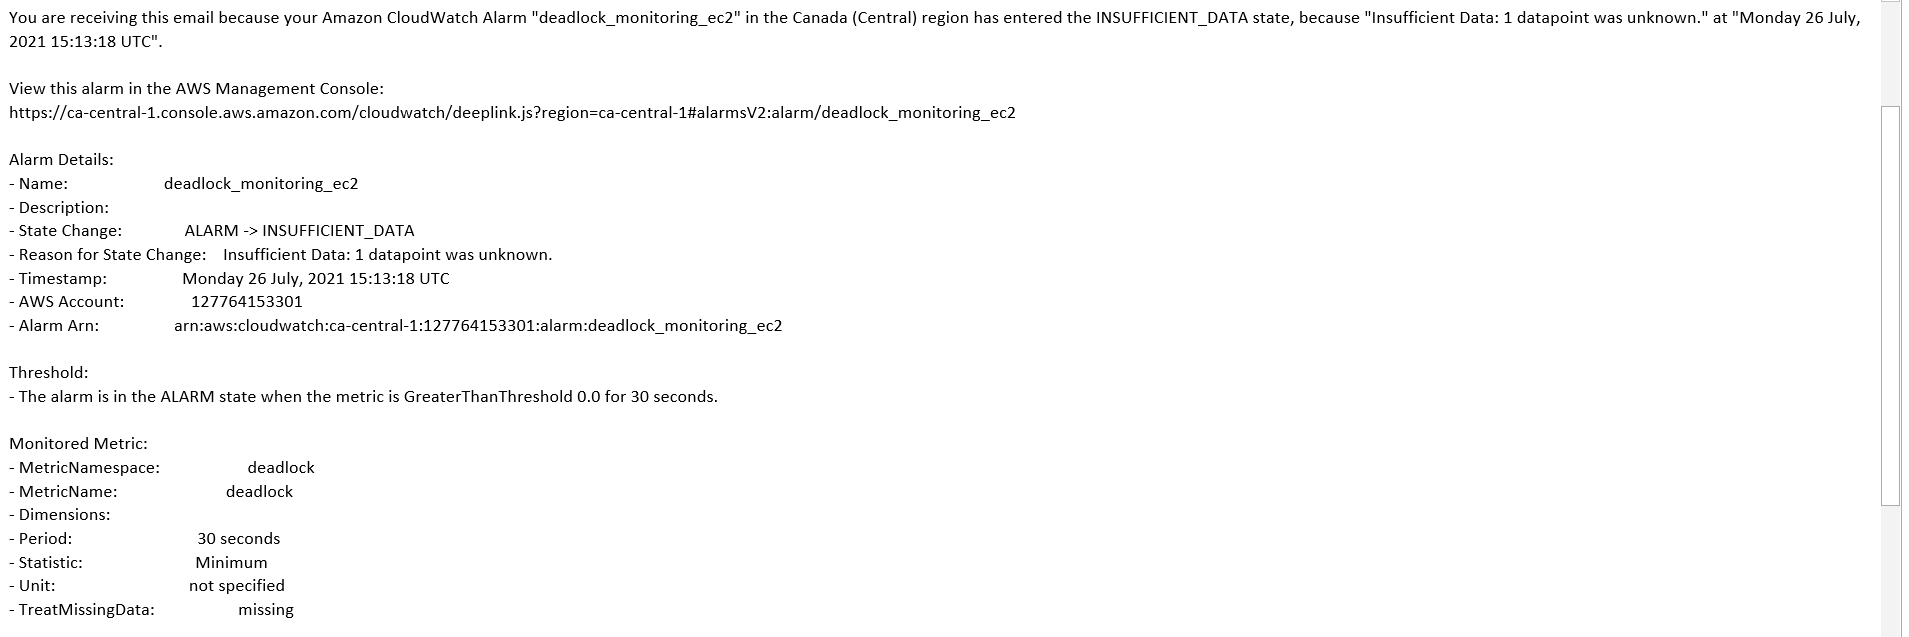
Clean up
When you’re finished using the resources in this post, clean up the AWS resources to avoid incurring unwanted charges. Specifically, delete the following resources.
SQL Server on EC2 instance
CloudWatch logs
SNS Topic
Conclusion
In this post, we showed you how to monitor and get notified when deadlocks occur in SQL Server running on EC2 instances. We used CloudWatch and SNS notifications to instrument the solution. Although we focused on deadlocks, you can extend this solution for monitoring and getting notified on any SQL Server log events or fatal errors.
To learn more about log monitoring on Amazon EC2 using CloudWatch, see Automate IIS and HttpErr Logs to Amazon CloudWatch Using EC2 Systems Manager. You can also monitor SQL Server using CloudWatch and AWS Systems Manager.
To learn about Amazon RDS for SQL Server monitoring for deadlocks, see Monitor deadlocks in Amazon RDS for SQL Server and set notifications using Amazon CloudWatch.
About the Authors
Yogi Barot is Microsoft Specialist Senior Solution Architect at AWS, she has 22 years of experience working with different Microsoft technologies, her specialty is in SQL Server and different database technologies. Yogi has in depth AWS knowledge and expertise in running Microsoft workload on AWS.
Read MoreAWS Database Blog