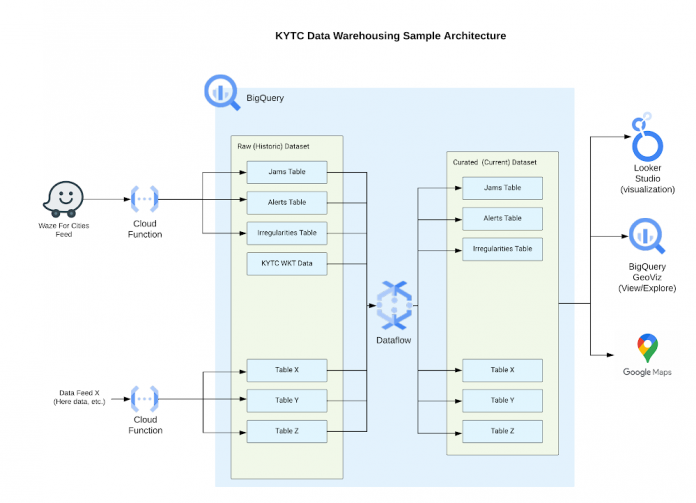
Transportation agencies face the challenge of managing heavy amounts of data from diverse and high-velocity sources. It can be difficult to gather insights across the disparate sources, let alone be fast enough to inform operational decisions. Traditionally, agencies rely on yearly reporting to understand the state of their operations, but this limits their ability to act quickly on emerging problems. At Google, we see a future where every government leader can draw insights from their big data on-demand. BigQuery, our cloud data warehouse, can address data volume, consolidation, and freshness without a high degree of technical specialization.
Kentucky Transportation Cabinet transformed safety operations with data
For example, Kentucky Transportation Cabinet (KYTC) outgrew an on-premise Hadoop cluster as it attempted to combine HERE®, Waze, weather, and road segment geospatial data. By consolidating the analytics into BigQuery, reporting could be done both at petabyte-scale and in near-real time with streaming data.
Once they consolidated data into BigQuery, new use cases started to emerge for KYTC. During the snowstorms of 2021, the operations team generated materialized views to efficiently monitor signs of congestion on throughways. Every 10 minutes became a decision point on whether crews should be proactively dispatched, as the team could infer the flow of traffic based on the data instead of relying on humans or 3rd party sources, which may be unable to provide the data clearly or with specificity. Another use case is providing transparency to the public by presenting multiple layers of roadway events on a public Maps application.
Many government organizations are members of the Waze of Cities program, which offers direct access to five years of their jurisdiction’s jams, alerts, and irregularities data already hosted on BigQuery. Google’s onboarding guide provides excellent starter queries to understand what’s happening on the roads. To take it a step further, agencies can make use of machine learning (ML) capabilities and public datasets in BigQuery to model incidents.
Modeling road conditions and safety using Waze and weather data
As a proof of concept, let’s correlate precipitation with accidents using BigQuery in Google Cloud. We can join the National Oceanic and Atmospheric Administration’s (NOAA) daily Global Historical Climatology Network (GHCN) precipitation numbers with our Alerts table from Waze with the following query. Note: Be sure to have “write access” to a Google Cloud project and BigQuery dataset.
Once built, this query provides a training dataset for creating a machine learning (ML)model. Feel free to replace the subtype feature from ACCIDENT_MINOR to HAZARD_ON_ROAD_POT_HOLE or HAZARD_WEATHER_FLOOD if you wish to create further predictions on those.
You can then create an ML model using the query below:
The model’s features are the precipitation amount (tenths of mm) and whether it’s a weekday, and the output is the predicted number of accidents. After the query completes, we’ll be able to use this model for prediction by “querying” the model like a Structured Query Language (SQL) table.
The predicted number of accidents is around 14. We also asked the model to explain how each feature was attributed to the result. This can be useful for agencies to understand what factors they need to influence to reach safety outcomes in their respective jurisdictions.
Next steps
Start working on building your own models using these queries as a first step. Access to the Waze tables in BigQuery is controlled in the Waze Partner Hub. If you would like any additional information or help with getting set up, please reach out to your Google Public Sector Account Team or contact here.
Cloud BlogRead More


