

Leaflet is one of the most popular JavaScript library for creating interactive maps. In R you have a package for the same which calls this Javascript library in background. It makes it easy to create interactive maps in shiny app.
If you want to put it into your presentation, you can also do the same. Maps can be opened in RStudio’s Viewer tab and also in a web browser. You can also save map as Image by using Exportfunctionality of RStudio and put it into the presentation.
leaflet allows you to create maps which have functionality of zoom-in and out, panning and can also connect your geographical data with map and play it by changing values in dropdown and radiobutton widgets
First Step : Install the leaflet R package by using the command install.packages(“leaflet”)
Before producing map what you all need is latitude and longitude of the places you want to show it in the map. If you have zip code or postal code you need to convert them to lat and long. You can refer this link – Convert Zip Code to Lat/Long
library(leaflet)
leaflet() %>%
addTiles() %>%
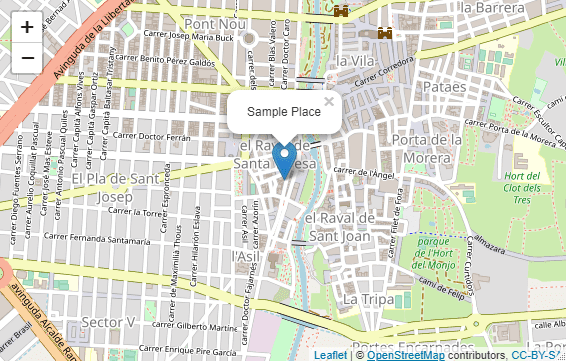
addMarkers(lng=-0.7011, lat=38.2622, popup=”Sample Place”)
addTiles() inserts tiles to the map and creates a basic map. addMarkers() shows mark on the lat and long you input. When you click on the marker, it shows popup with the message you entered in the popup argument.
In this section I have created a sample dataframe which consists of information of 7 different places and their lat and long.
df 42.85 -2.6727
38.3452 -0.4815
38.161 -0.8013
38.1631 -0.8115
38.1673 -0.8034
38.1776 -0.7973
37.9787 -0.6822
‘)
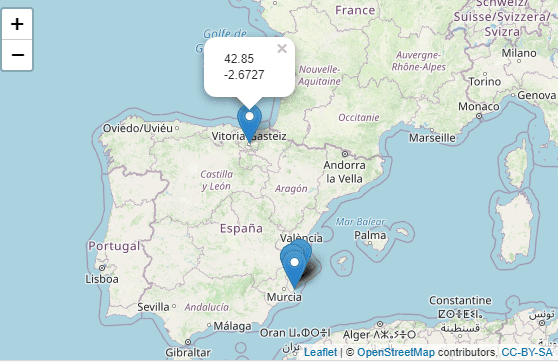
You can define dataframe name in leaflet() function (as shown below). Tilde ~ is supported here to mention column names of the dataframe.
leaflet(df) %>%
addTiles() %>%
addMarkers(lng= ~longitude, lat=~latitude,
popup = ~paste(latitude, longitude, sep = ‘<br/>’))
<br/> is a html code used to create a new line in the popup message. Here longitude is entered in the new line. You can show any message in the popup by concatenating using paste() function.
You can disable close button in popup box by using argument popupOptions.
leaflet(df) %>%
addTiles() %>%
addMarkers(lng= ~longitude, lat=~latitude,
popup = ~paste(latitude, longitude, sep = ‘<br/>’),
popupOptions = popupOptions(closeButton = FALSE))
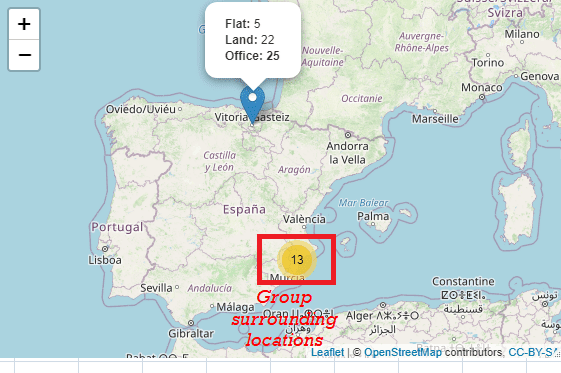
Suppose you are working as an analyst for real estate company and are asked to show the number of properties owned by your organisation in different locations by property type on the map. To demonstrate this example, lets create a dummy dataframe having count of properties by asset type.
df2 latitude longitude Flat Land Office
42.85 -2.6727 5 22 25
38.3452 -0.4815 2 24 25
38.161 -0.8013 5 17 11
38.1631 -0.8115 5 22 24
38.1673 -0.8034 5 15 13
38.1776 -0.7973 5 21 16
37.9787 -0.6822 2 11 16
38.2622 -0.7011 61 24 16
39.9333 -0.1 0 14 13
38.0848 -0.944 0 21 21
38.125 -0.8782 3 18 14
38.1339 -0.8624 3 12 15
38.1518 -0.8308 3 21 20
38.6253 -0.5722 3 14 14
‘)
leaflet(df2) %>%
addTiles() %>%
addMarkers(lat = ~latitude, lng = ~longitude,
clusterOptions = markerClusterOptions(zoomToBoundsOnClick = T),
popup = ~paste(
paste(‘<b>’, ‘Flat:’, ‘</b>’, Flat),
paste(‘<b>’, ‘Land:’, ‘</b>’, Land),
paste(‘<b>’, ‘Office:’, Office),
sep = ‘<br/>’),
popupOptions = popupOptions(closeButton = FALSE)
)
This is useful when you have a high number of markers on a map so it would useful to cluster them by using the command below –
clusterOptions = markerClusterOptions(zoomToBoundsOnClick = T)
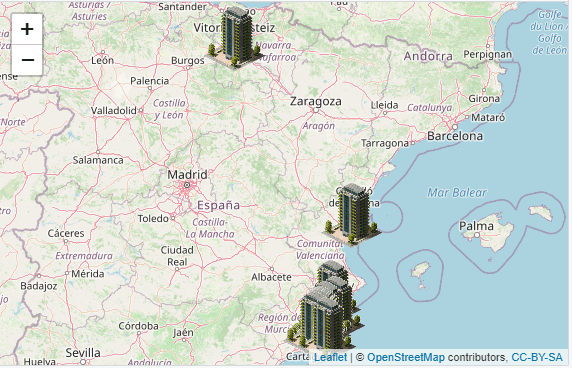
If you are bored of default icon for showing location in the map, you should be glad to know that there is an option in leaflet named icon = list( ) for including icons you wish to display in the map.
leaflet(df2) %>%
addTiles() %>%
addMarkers(lat = ~latitude, lng = ~longitude,
icon = list(
iconUrl = ‘https://colepowered.com/wordpress/wp-content/uploads/2014/10/29102014-8.png’,
iconSize = c(75, 75))
)
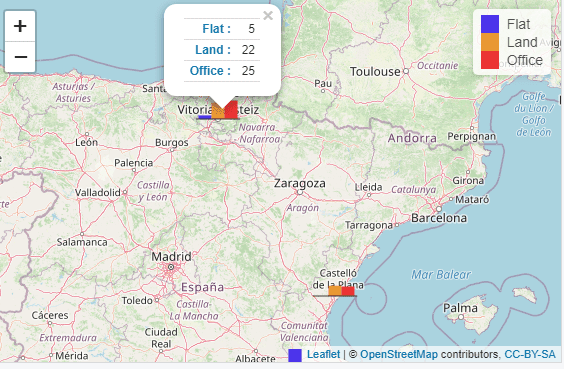
To include chart in leaflet map, you can use leaflet.minicharts package. It works alongside with the leaflet package. It supports various parameters to customise colors and positioning of legends of chart.
library(leaflet.minicharts)
library(dplyr)
chartdf % select(Flat, Land, Office)
colors
leaflet() %>% addTiles() %>%
addMinicharts(df2$longitude,
df2$latitude,
type = “bar”,
chartdata = chartdf,
colorPalette = colors,
legend = TRUE,
legendPosition = “topright”,
width = 45, height = 45)
Following are the types of chart supported in this package. “bar” for bar charts”pie” for pie charts”polar-area” and “polar-radius” for polar area charts
To show live weather in map, you need to register yourself and create an account in Open Weather Map. Once created you would get API key via email and it will be activated in next couple of hours. API key needs to be entered in the program below (highlighted in bold).
leaflet() %>%
addProviderTiles(providers$CartoDB.Positron) %>%
addMarkers(lat = ~latitude, lng = ~longitude) %>%
addProviderTiles(providers$OpenWeatherMap.Wind,
options=providerTileOptions(apiKey=”open-weather-api-key”))
In general interactive maps are shown in shiny app. If you are not familiar with shiny app, you should explore it as it is one of the easiest way to build a web app or online dashboard for free. It does not require knowledge of web programming languages like Javascript, CSS and HTML. In UI portion of the shiny app, you need to use leafletOutput() function to include leaflet widget.In server side you can wrap your code in renderLeaflet({ … }).
library(shiny)
library(leaflet)
ui
server
output$map1 leaflet(df2) %>%
addTiles() %>%
addMarkers(lat = ~latitude, lng = ~longitude)
})
}
shinyApp(ui, server)
There are many times when you need to modify map in real time. To accomplish this task, you use leafletProxy() function instead of leaflet()Read MoreListenData