

This is a guest post co-written with Moulham Zahabi from Matarat.
Probably everyone has checked their baggage when flying, and waited anxiously for their bags to appear at the carousel. Successful and timely delivery of your bags depends on a massive infrastructure called the baggage handling system (BHS). This infrastructure is one of the key functions of successful airport operations. Successfully handling baggage and cargo for departing and arriving flights is critical to ensure customer satisfaction and deliver airport operational excellence. This function is heavily dependent on the continuous operation of the BHS and the effectiveness of maintenance operations. As the lifeline of the airports, a BHS is a linear asset that can exceed 34,000 meters in length (for a single airport) handling over 70 million bags annually, making it one of the most complex automated systems and a vital component of airport operations.
Unplanned downtime of a baggage handling system, whether be it a conveyor belt, carousel, or sorter unit, can disrupt airport operations. Such disruption is bound to create an unpleasant passenger experience and possibly impose penalties on airport service providers.
The prevalent challenge with maintaining a baggage handling system is how to operate an integrated system of over 7,000 assets and over a million setpoints continuously. These systems also handle millions of bags in different shapes and sizes. It’s safe to assume that baggage handling systems are prone to error. Because the elements function in a closed loop, if one element breaks down, it affects the entire line. Traditional maintenance activities rely on a sizable workforce distributed across key locations along the BHS dispatched by operators in the event of an operational fault. Maintenance teams also rely heavily on supplier recommendations to schedule downtime for preventive maintenance. Determining if preventive maintenance activities are properly implemented or monitoring the performance of this type of asset may be unreliable and doesn’t reduce the risk of unanticipated downtime.
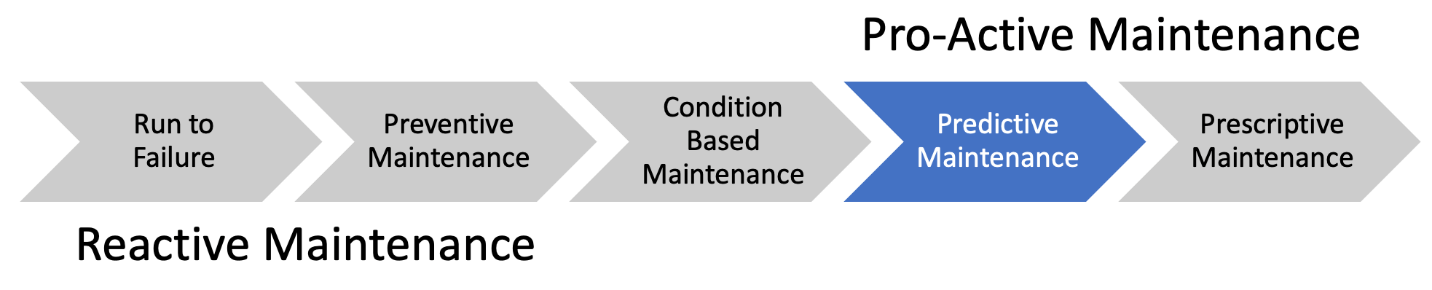
Spare parts management is an additional challenge as lead times are increasing due to global supply chain disruptions, yet inventory replenishment decisions are based on historical trends. In addition, these trends don’t incorporate the volatile dynamic environment of operating BHS assets as they age. To address these challenges, a seismic shift needs to happen in maintenance strategies—moving from a reactive to proactive mindset. This shift requires operators to utilize the latest technology to streamline maintenance activities, optimize operations, and minimize operating expenses.
In this post, we describe how AWS Partner Airis Solutions used Amazon Lookout for Equipment, AWS Internet of Things (IoT) services, and CloudRail sensor technologies to provide a state-of-the-art solution to address these challenges.
Baggage handling system overview
The following diagram and table illustrate the measurements taken across a typical carousel in King Khalid International Airport in Riyadh.
Data is collected at the different locations illustrated in the diagram.
Sensor Type
Business value
Datasets
Location
IO Link Speed Sensors
Homogeneous Carousel Speed
PDV1 (1 per min)
C
Vibration Sensor with Integrated
Temperature Sensor
Loose Screw,
Shaft Misaligned,
Bearing Damage,
Motor Winding Damage
Fatigue (v-RMS) (m/s)
Impact (a-Peak) (m/s^2)
Friction (a-RMS) (m/s^2)
Temperature (C)
Crest
A and B
Distance PEC Sensor
Baggage Throughput
Distance (cm)
D
The following images show the environment and monitoring equipment for the various measurements.
Vibration sensor mounted on one of the conveyor motors
Proximity probe measuring carousel speed
Line of sight of the baggage throughput counter (using a distance sensor)
Thermal image of one of the conveyor motors
Solution overview
The predictive maintenance system (PdMS) for baggage handling systems is a reference architecture that aids airport maintenance operators in their journey to have data as an enabler in improving unplanned downtime. It contains building blocks to accelerate the development and deployment of connected sensors and services. The PdMS includes AWS services to securely manage the lifecycle of edge compute devices and BHS assets, cloud data ingestion, storage, machine learning (ML) inference models, and business logic to power proactive equipment maintenance in the cloud.
This architecture was built from lessons learned while working with airport operations over several years. The proposed solution was developed with the support of Northbay Solutions, an AWS Premier Partner, and can be deployed to airports of all sizes and scales to thousands of connected devices within 90 days.
The following architecture diagram exposes the underlying components used to build the predictive maintenance solution:
We use the following services to assemble our architecture:
CloudRail.DMC is a software as a service (SaaS) solution by the German IoT expert CloudRail GmbH. This organization manages fleets of globally distributed edge gateways. With this service, industrial sensors, smart meters, and OPC UA servers can be connected to an AWS data lake with just a few clicks.
AWS IoT Core lets you connect billions of IoT devices and route trillions of messages to AWS services without managing infrastructure. It securely transmits messages to and from all of your IoT devices and applications with low latency and high throughput. We use AWS IoT Core to connect to the CloudRail sensors and forward their measurements to the AWS Cloud.
AWS IoT Analytics is a fully managed service that makes it easy to run and operationalize sophisticated analytics on massive volumes of IoT data without having to worry about the cost and complexity typically required to build an IoT analytics platform. It’s an easy way to run analytics on IoT data to gain accurate insights.
Amazon Lookout for Equipment analyzes data from equipment sensors to create an ML model automatically for your equipment based on asset specific data—no data science skills necessary. Lookout for Equipment analyzes incoming sensor data in real time and accurately identifies early warning signals that could lead to unexpected downtime.
Amazon QuickSight allows everyone in the organization to understand the data by asking questions in natural language, visualizing information through interactive dashboards, and automatically looking for patterns and outliers powered by ML.
As illustrated in the following diagram, this architecture enables sensor data to flow to operational insights.
Data points are collected using IO-Link sensors: IO-Link is a standardized interface to enable seamless communication from the control level of an industrial asset (in our case, the baggage handling system) to the sensor level. This protocol is used to feed sensor data into a CloudRail edge gateway and loaded into AWS IoT Core. The latter then provides equipment data to ML models to identify operational and equipment issues that can be used to determine optimal timing for asset maintenance or replacement without incurring unnecessary costs.
Data collection
Retrofitting existing assets and their controls systems to the cloud remains a challenging approach for operators of equipment. Adding secondary sensors provides a fast and secure way to acquire the necessary data while not interfering with existing systems. Therefore, it’s easier, faster, and non-invasive compared to the direct connection of a machine’s PLCs. Additionally, retrofitted sensors can be selected to precisely measure the data points required for specific failure modes.
With CloudRail, every industrial IO-Link sensor can be connected to AWS services like AWS IoT Core, AWS IoT SiteWise, or AWS IoT Greengrass within a few seconds through a cloud-based device management portal (CloudRail.DMC). This enables IoT experts to work from centralized locations and onboard physical systems that are globally distributed. The solution solves the challenges of data connectivity for predictive maintenance systems through an easy plug-and-play mechanism.
The gateway acts as the Industrial Demilitarized Zone (IDMZ) between the equipment (OT) and the cloud service (IT). Through an integrated fleet management application, CloudRail ensures that the latest security patches are rolled out automatically to thousands of installations.
The following image shows an IO-Link sensor and the CloudRail edge gateway (in orange):
Training an anomaly detection model
Organizations from most industrial segments see modern maintenance strategies moving away from the run-to-failure, reactive approaches and progressing towards more predictive methods. However, moving to a condition-based or predictive maintenance approach requires data collected from sensors installed throughout facilities. Using historical data captured by these sensors in conjunction with analytics helps identify precursors to equipment failures, which allows maintenance personnel to act accordingly before breakdown.
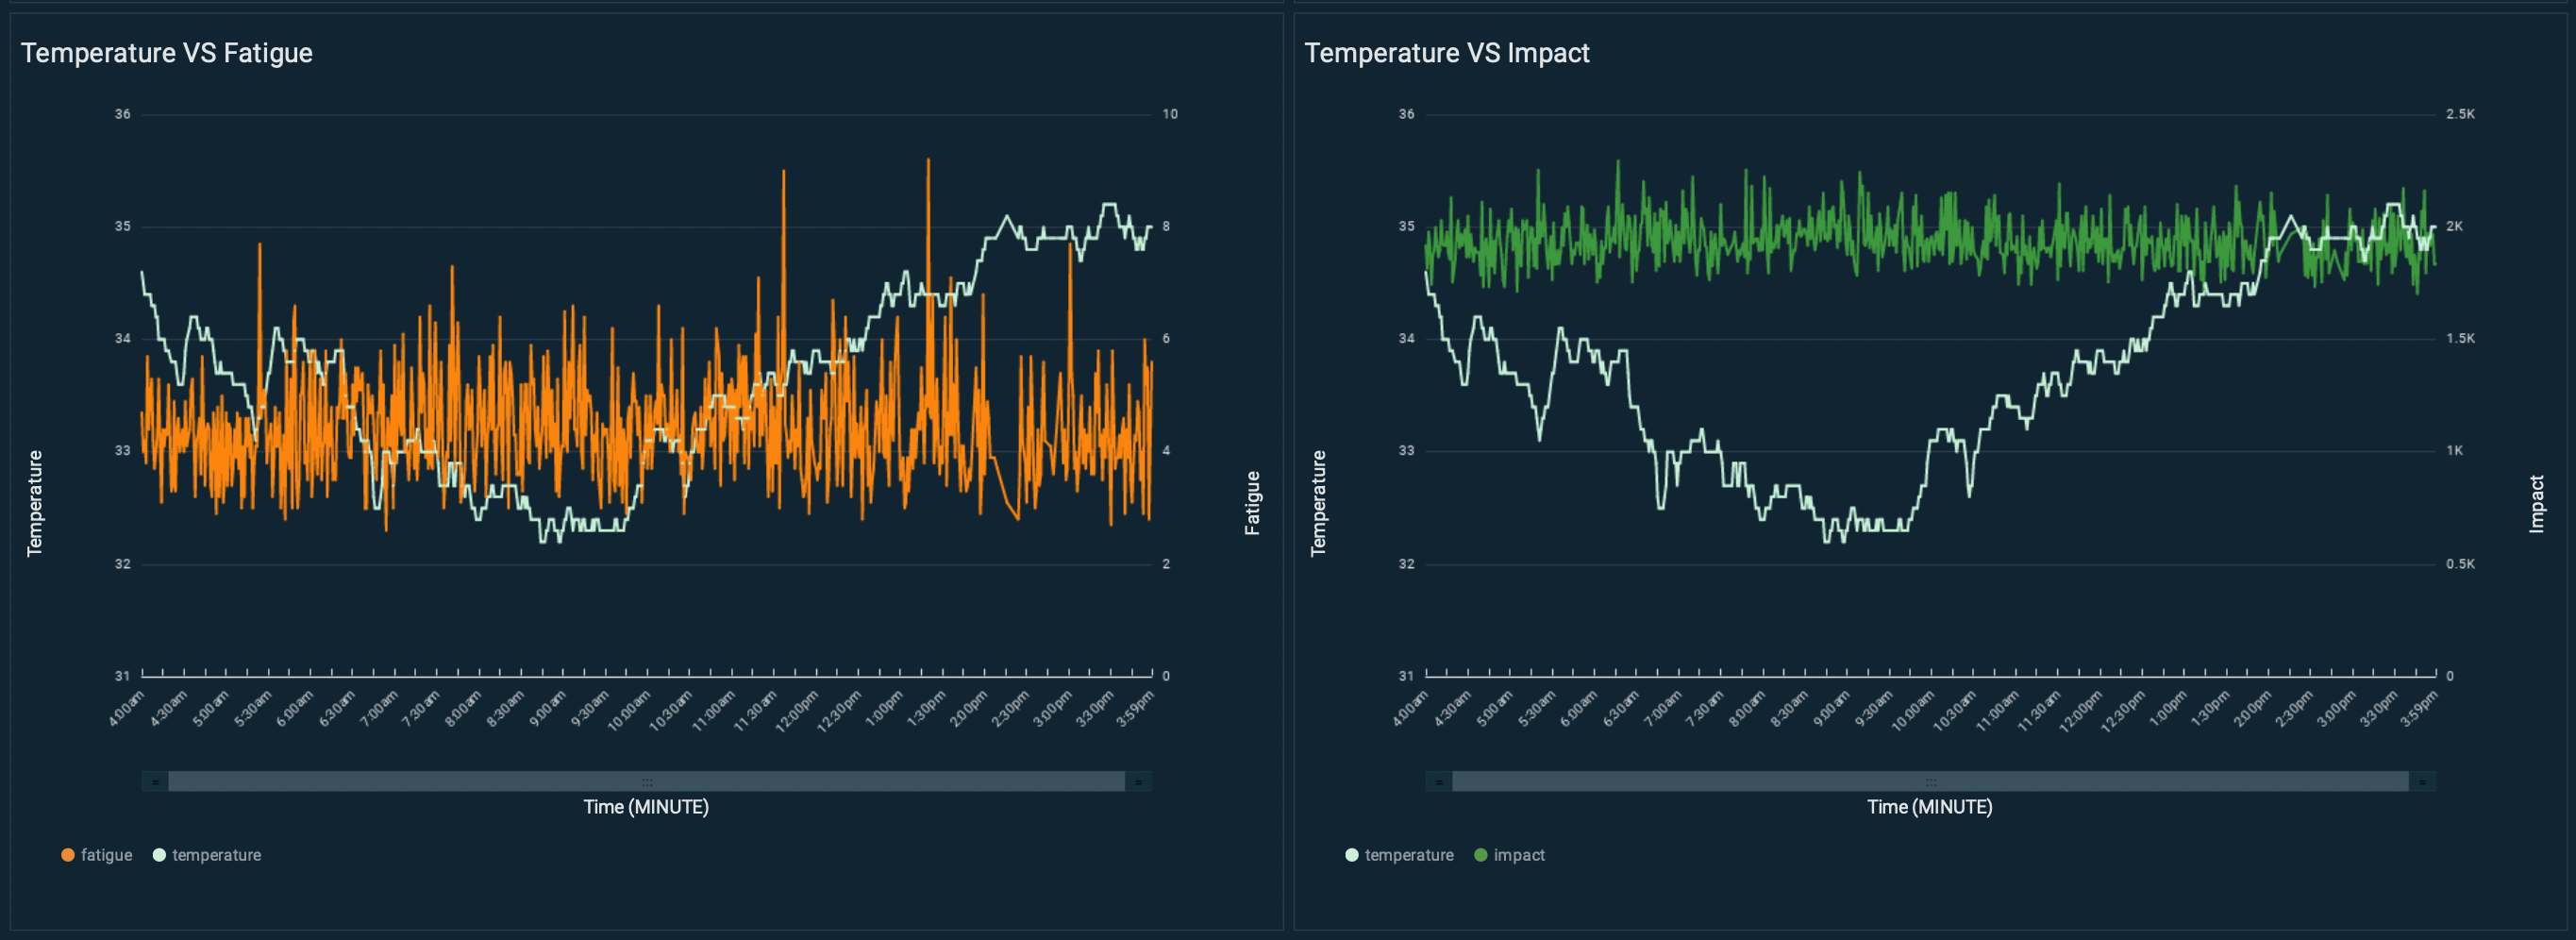
Predictive maintenance systems rely on the capability to identify when failures could occur. Equipment OEMs usually provide datasheets for their equipment and recommend monitoring certain operational metrics based on near-perfect conditions. However, these conditions are rarely realistic because of the natural wear of the asset, the environmental conditions it operates in, its past maintenance history, or just the way you need to operate it to achieve your business outcomes. For instance, two identical motors (make, model, production date) were installed in the same carousel for this proof of concept. These motors operated at different temperature ranges due to different weather exposure (one part of the conveyor belt on the inside and the other outside of the airport terminal).
Motor 1 operated in a temperature ranging from 32–35°C. Vibration velocity RMS can change due to motor fatigue (for example, alignment errors or imbalance problems). As shown in the following figure, this motor shows fatigue levels ranging between 2–6, with some peaks at 9.
Motor 2 operated in a cooler environment, where the temperature was ranging between 20–25°C. In this context, motor 2 shows fatigue levels between 4–8, with some peaks at 10:
Most ML approaches expect very specific domain knowledge and information (often difficult to obtain) that must be extracted from the way you operate and maintain each asset (for example, failure degradation patterns). This work needs to be performed each time you want to monitor a new asset, or if the asset conditions change significantly (such as when you replace a part). This means that a great model delivered at the prototyping phase will likely see a performance hit when rolled out on other assets, drastically reducing the accuracy of the system and in the end, losing the end-users’ confidence. This may also cause many false positives, and you would need the skills necessary to find your valid signals in all the noise.
Lookout for Equipment only analyzes your time series data to learn the normal relationships between your signals. Then, when these relationships start to deviate from the normal operating conditions (captured at training state), the service will flag the anomaly. We found that strictly using historical data for each asset lets you focus on technologies that can learn the operating conditions that will be unique to a given asset in the very environment it’s operating in. This lets you deliver predictions supporting root cause analysis and predictive maintenance practices at a granular, per-asset level and macro level (by assembling the appropriate dashboard to let you get an overview of multiple assets at once). This is the approach we took and the reason we decided to use Lookout for Equipment.
Training strategy: Addressing the cold start challenge
The BHS we targeted wasn’t instrumented at first. We installed CloudRail sensors to start collecting new measurements from our system, but this meant we only had a limited historical depth to train our ML model. We addressed the cold start challenge in this case by recognizing that we are building a continuously improving system. After the sensors were installed, we collected an hour of data and duplicated this information to start using Lookout for Equipment as soon as possible and test our overall pipeline.
As expected, the first results were quite unstable because the ML model was exposed to a very small period of operations. This meant that any new behavior not seen during the first hour would be flagged. When looking at the top-ranking sensors, the temperature on one of the motors seemed to be the main suspect (T2_MUC_ES_MTRL_TMP in orange in the following figure). Because the initial data capture was very narrow (1 hour), over the course of the day, the main change was coming from the temperature values (which is consistent with the environmental conditions at that time).
When matching this with the environmental conditions around this specific conveyor belt, we confirmed that the outside temperature increased severely, which, in turn, increased the temperature measured by this sensor. In this case, after the new data (accounting for the outside temperature increase) is incorporated into the training dataset, it will be part of the normal behavior as captured by Lookout for Equipment and similar behavior in the future will be less likely to raise any events.
After 5 days, the model was retrained and the false positive rates immediately fell drastically:
Although this cold start problem was an initial challenge to obtain actionable insights, we used this opportunity to build a retraining mechanism the end-user can trigger easily. A month into the experimentation, we trained a new model by duplicating a month’s worth of sensor data into 3 months. This continued to reduce the false positive rates as the model was exposed to a broader set of conditions. A similar false positive rate drop happened after this retraining: the condition modeled by the system was closer to what users are experiencing in real life. After 3 months, we finally had a dataset that we could use without using this duplication trick.
From now on, we will launch a retraining every 3 months and, as soon as possible, will use up to 1 year of data to account for the environmental condition seasonality. When deploying this system on other assets, we will be able to reuse this automated process and use the initial training to validate our sensor data pipeline.
After the model was trained, we deployed the model and started sending live data to Lookout for Equipment. Lookout for Equipment lets you configure a scheduler that wakes up regularly (for example, every hour) to send fresh data to the trained model and collect the results.
Now that we know how to train, improve, and deploy a model, let’s look at the operational dashboards implemented for the end-users.
Data visualization and insights
End-users need a way to extract more value from their operational data to better improve their asset utilization. With QuickSight, we connected the dashboard to the raw measurement data provided by our IoT system, allowing users to compare and contrast key pieces of equipment on a given BHS.
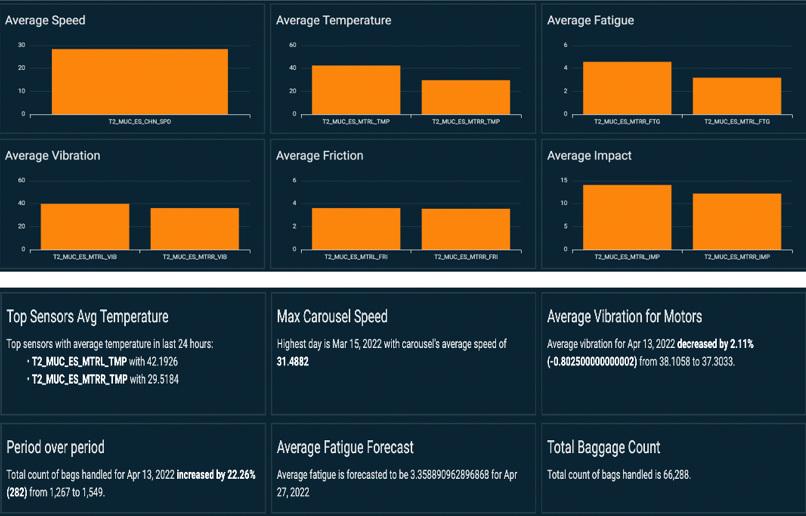
In the following dashboard, users can check the key sensors used to monitor the condition of the BHS and obtain period-over-period metrics changes.
In the preceding plot, users can visualize any unexpected imbalance of the measurement for each motor (left and right plots for temperature, fatigue, vibration, friction, and impact). At the bottom, key performance indicators are summarized, with forecast and period-over-period trends called out.
End-users can access information for the following purposes:
View historical data in intervals of 2 hours up to 24 hours.
Extract raw data via CSV format for external integration.
Visualize asset performance over a set period of time.
Produce insights for operational planning and improve asset utilization.
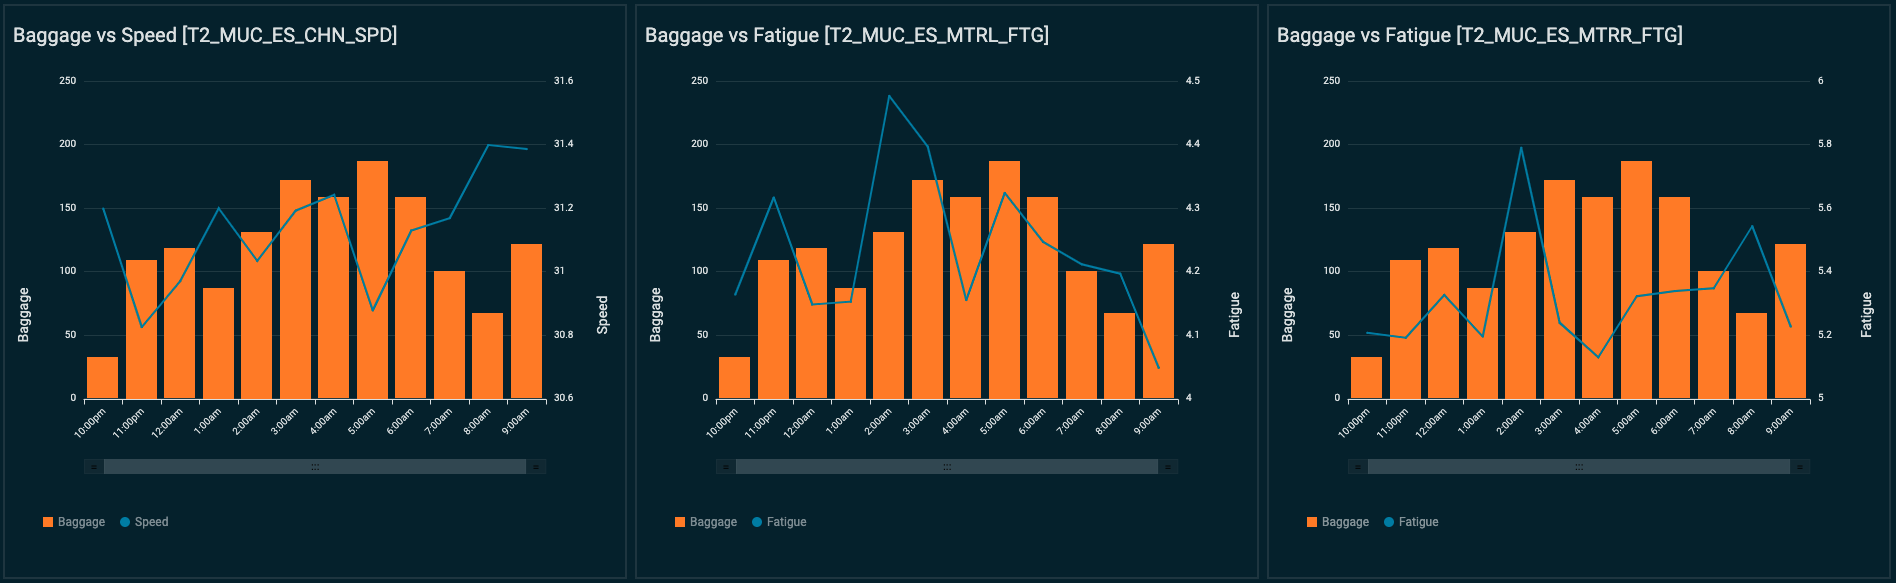
Perform correlation analysis. In the following plot, the user can visualize several measurements (such as motor fatigue vs. temperature, or baggage throughput vs. carousel speed) and use this dashboard to better inform the next best maintenance action.
Eliminating noise from the data
After a few weeks, we noticed that Lookout for Equipment was emitting some events thought to be false positives.
When analyzing these events, we discovered irregular drops in the speed of the carousel motor.
We met with the maintenance team and they informed us these stops were either emergency stops or planned downtime maintenance activities. With this information, we labeled the emergency stops as anomalies and fed them to Lookout for Equipment, while the planned downtimes were considered normal behavior for this carousel.
Understanding such scenarios where abnormal data can be influenced by controlled external actions is critical to improve the anomaly detection model accuracy over time.
Smoke testing
After a few hours from retraining the model and achieving relatively no anomalies, our team physically stressed the assets, which was immediately detected by the system. This is a common request from users because they need to familiarize themselves with the system and how it reacts.
We built our dashboard to allow end-users to visualize historical anomalies with an unlimited period. Using a business intelligence service let them organize their data at will, and we have found that bar charts over a 24-hour period or pie charts are the best way to get a good view of the condition of the BHS. In addition to the dashboards that users can view whenever they need, we set up automated alerts sent to a designated email address and via text message.
Extracting deeper insights from anomaly detection models
In the future, we intend to extract deeper insights from the anomaly detection models trained with Lookout for Equipment. We will continue to use QuickSight to build an expanded set of widgets. For instance, we have found that the data visualization widgets exposed in the GitHub samples for Lookout for Equipment allow us to extract even more insights from the raw outputs of our models.
Results
Reactive maintenance in baggage handling systems translates to the following:
Lower passenger satisfaction due to lengthy wait times or damaged baggage
Lower asset availability due to the unplanned failures and inventory shortage of critical spare parts
Higher operating expenses due to rising inventory levels in addition to higher maintenance costs
Evolving your maintenance strategy to incorporate reliable, predictive analytics into the cycle of decision-making aims to improve asset operation and help avoid forced shutdowns.
The monitoring equipment was installed locally in 1 day and configured completely remotely by IoT experts. The cloud architecture described in the solution overview was then successfully deployed within 90 days. A fast implementation time proves the benefits proposed to the end-user, quickly leading to a shift in maintenance strategy from human-based reactive (fixing breakdowns) to machine-based, data-driven proactive (preventing downtimes).
Conclusion
The cooperation between Airis, CloudRail, Northbay Solutions, and AWS led to new achievement at the King Khalid International Airport (see the press release for more details). As part of their digital transformation strategy, the Riyadh Airport plans on further deployments to cover other electro-mechanical systems like passenger boarding bridges and HVAC systems.
If you have comments about this post, please submit them in the comments section. If you have questions about this solution or its implementation, please start a new thread on re:Post, where AWS experts and the broader community can support you.
About the authors
Moulham Zahabi is an aviation specialist with over 11 years of experience in designing and managing aviation projects, and managing critical airport assets in the GCC region. He is also one of the co-founders of Airis-Solutions.ai, which aims to lead the aviation industry’s digital transformation through innovative AI/ML solutions for airports and logistical centers. Today, Moulham is heading the Asset Management Directorate in the Saudi Civil Aviation Holding Company (Matarat).
Fauzan Khan is a Senior Solutions Architect working with public sector customers, providing guidance to design, deploy, and manage their AWS workloads and architectures. Fauzan is passionate about helping customers adopt innovative cloud technologies in the area of HPC and AI/ML to address business challenges. Outside of work, Fauzan enjoys spending time in nature.
Michaël Hoarau is an AI/ML Specialist Solutions Architect at AWS who alternates between data scientist and machine learning architect, depending on the moment. He is passionate about bringing the AI/ML power to the shop floors of his industrial customers and has worked on a wide range of ML use cases, ranging from anomaly detection to predictive product quality or manufacturing optimization. He published a book on time series analysis in 2022 and regularly writes about this topic on LinkedIn and Medium. When not helping customers develop the next best machine learning experiences, he enjoys observing the stars, traveling, or playing the piano.
Read MoreAWS Machine Learning Blog