

We have seen customers overcoming rapid data growth challenges during 2020–2021.For customers working with PostgreSQL, a common bottleneck has been due to buffer_content locks caused by contention of data in high concurrency or large datasets. If you have experienced data contentions that resulted in buffer_content locks, you may have also faced a business-impacting reduction of the primary DB throughput (inserts and updates). We found that adopting architectural database best practices can help decrease and even avoid buffer_content lock contention.
In this post, we provide a benchmark that includes a real-world workload with characteristics that lead to the buffer_lock contention. We then propose the patterns to minimize the chance for buffer_content lock contention. We also share tips and best practices to minimize the application hot data, whether self-managed, hosted in Amazon Relational Database Service (Amazon RDS) for PostgreSQL or Amazon Aurora PostgreSQL-Compatible Edition.
We focus on Aurora because the issue manifests under hyper-scaled load in a highly concurrent server environment with 96 vCPUs, 768 GiB with terabytes of online transaction processing (OLTP) data. In addition, we provide configuration samples of discovering potential locks using anomaly detection techniques.
Amazon Aurora is a relational database service that combines the most popular open-source relational databases system and database reliability. Amazon Aurora offers metrics that enable the application developer to react to the locks before impacting the application, and you can adopt various relational database architectural patterns to avoid application interruption caused by the locks.
What is the PostgreSQL buffer_content lightweight lock?
PostgreSQL copies data from disk into shared memory buffers when reading or writing data. The management of the buffers in PostgreSQL consists of a buffer descriptor that contains metadata about the buffer and the buffer content that is read from the disk.
PostgreSQL utilizes lightweight locks (LWLocks) to synchronize and control access to the buffer content. A process acquires an LWLock in a shared mode to read from the buffer and an exclusive mode to write to the buffer. Therefore, while holding an exclusive lock, a process prevents other processes from acquiring a shared or exclusive lock. Also, a shared lock can be acquired concurrently by other processes. The issue starts when many processes acquire an exclusive lock on buffer content. As a result, developers can see LWLock:buffer_content become a top wait event in Performance Insights and pg_stat_activity.
Simulate buffer_content locks
We ran a benchmark with a load simulator that generated 1,000s transactions per second and 20 TB of data to demonstrate an application workload and data that causes the contention. We observed accumulations of buffer_content LWLocks during a peak load, where many sessions acquired an exclusive lock instead of a shared lock on a page during insert and update. This caused the database to reduce insert and update throughput and even caused the database to be unresponsive, resulting in application service interruption.
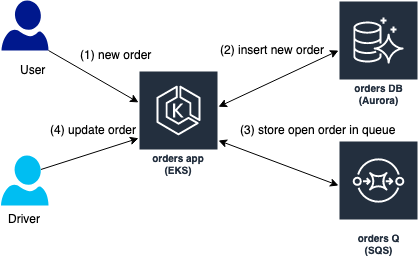
The load simulator mimics a fictitious application ordering system that allows users to place new orders (step 1 and 2 in the diagram) and update the orders throughout the order lifecycle (steps 3 and 4 in the diagram).
The load simulated by a cyclic positive sine wave that triggers thread that insert new orders. The orders are stored it in Amazon Simple Queue Service (SQS) queue for processing by another type of threads that updates the orders. The load consumes 20% of the database CPU and process up to 5000 transactions per second (denoted by xact_commit in the diagram)
Monitor and react to buffer_content locks to avoid application interruption
We found that the Amazon CloudWatch metric DBLoadNonCPU helps predict an incoming episode of buffer content locks because the lock is an active non-CPU event. When this occurs, it causes the process to wait while in an active state on a lock and not require CPU, which is similar behavior in the buffer_content LWLock case.
The central metric for Performance Insights is db.load, which is collected every second. This metric represents the average active sessions for the DB engine. The db.load metric is a time series grouped by the PostgreSQL wait events (dimensions). You can retrieve Performance Insights data through an API using the following AWS Command Line Interface (AWS CLI) code:
Instead of reading the wait events from Performance Insights, you can import the Performance Insights counters to CloudWatch and read it from CloudWatch if more metrics are used. We also suggest adding a CloudWatch alert that tracks anomalies in the DBLoadNonCPU metric value. We observed a correlation in anomalies in DBLoadNonCPU values before an increase of LWLock:buffer_content events. We also observed false positives that alarmed with no growth in buffer_content locks. We mitigated those by increasing the metric measurement period.
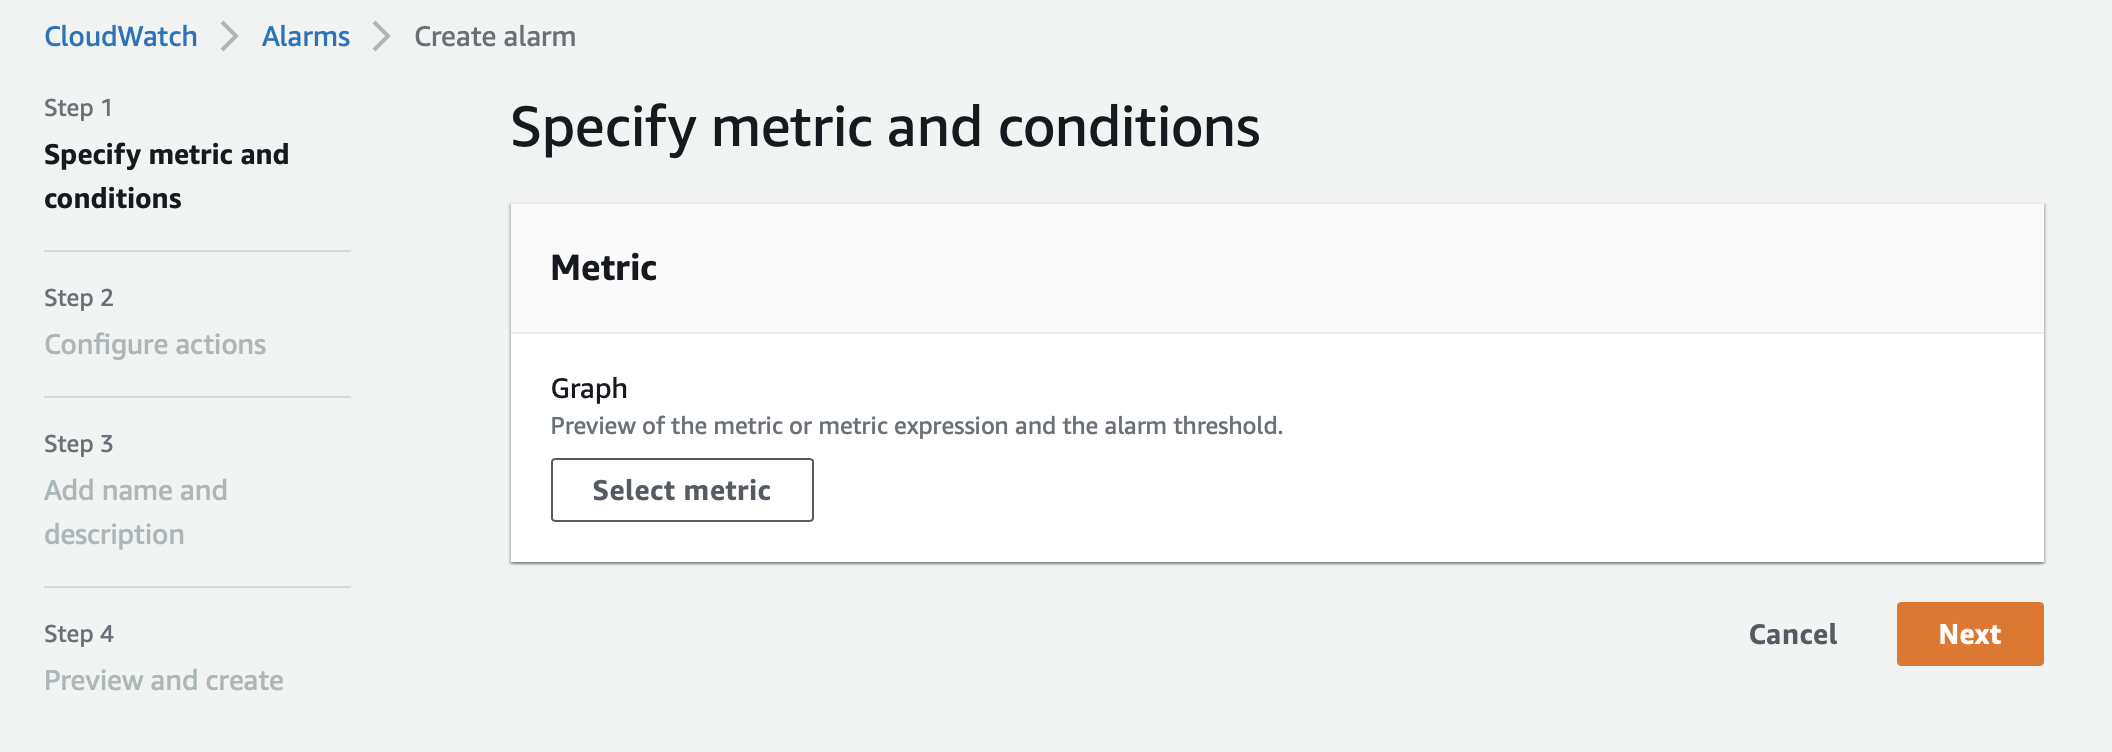
To configure the alert, complete the following steps:
On the CloudWatch console, choose Alarms in the navigation pane.
Choose Create alert.
Choose Select metric.
Search for and choose dbloadnoncpu.
Choose RDS-> Per-Database Metrics.
Choose the database instance.
Choose Select metric.
On the Metric page, under Statistic, choose Average.
For Period, choose 5 minutes.
Consider setting Period to 1 hour to reduce false positives. However, 1 hour could increase true negative cases, where the alert isn’t sent when a buffer content locks increases.
For Conditions, select Anomaly detection.
Select Greater than the band.
We do this because, in the event of lock contention, the number of processes waiting on a lock with no increase in CPU usage grows.
For Anomaly detection threshold, enter 2.
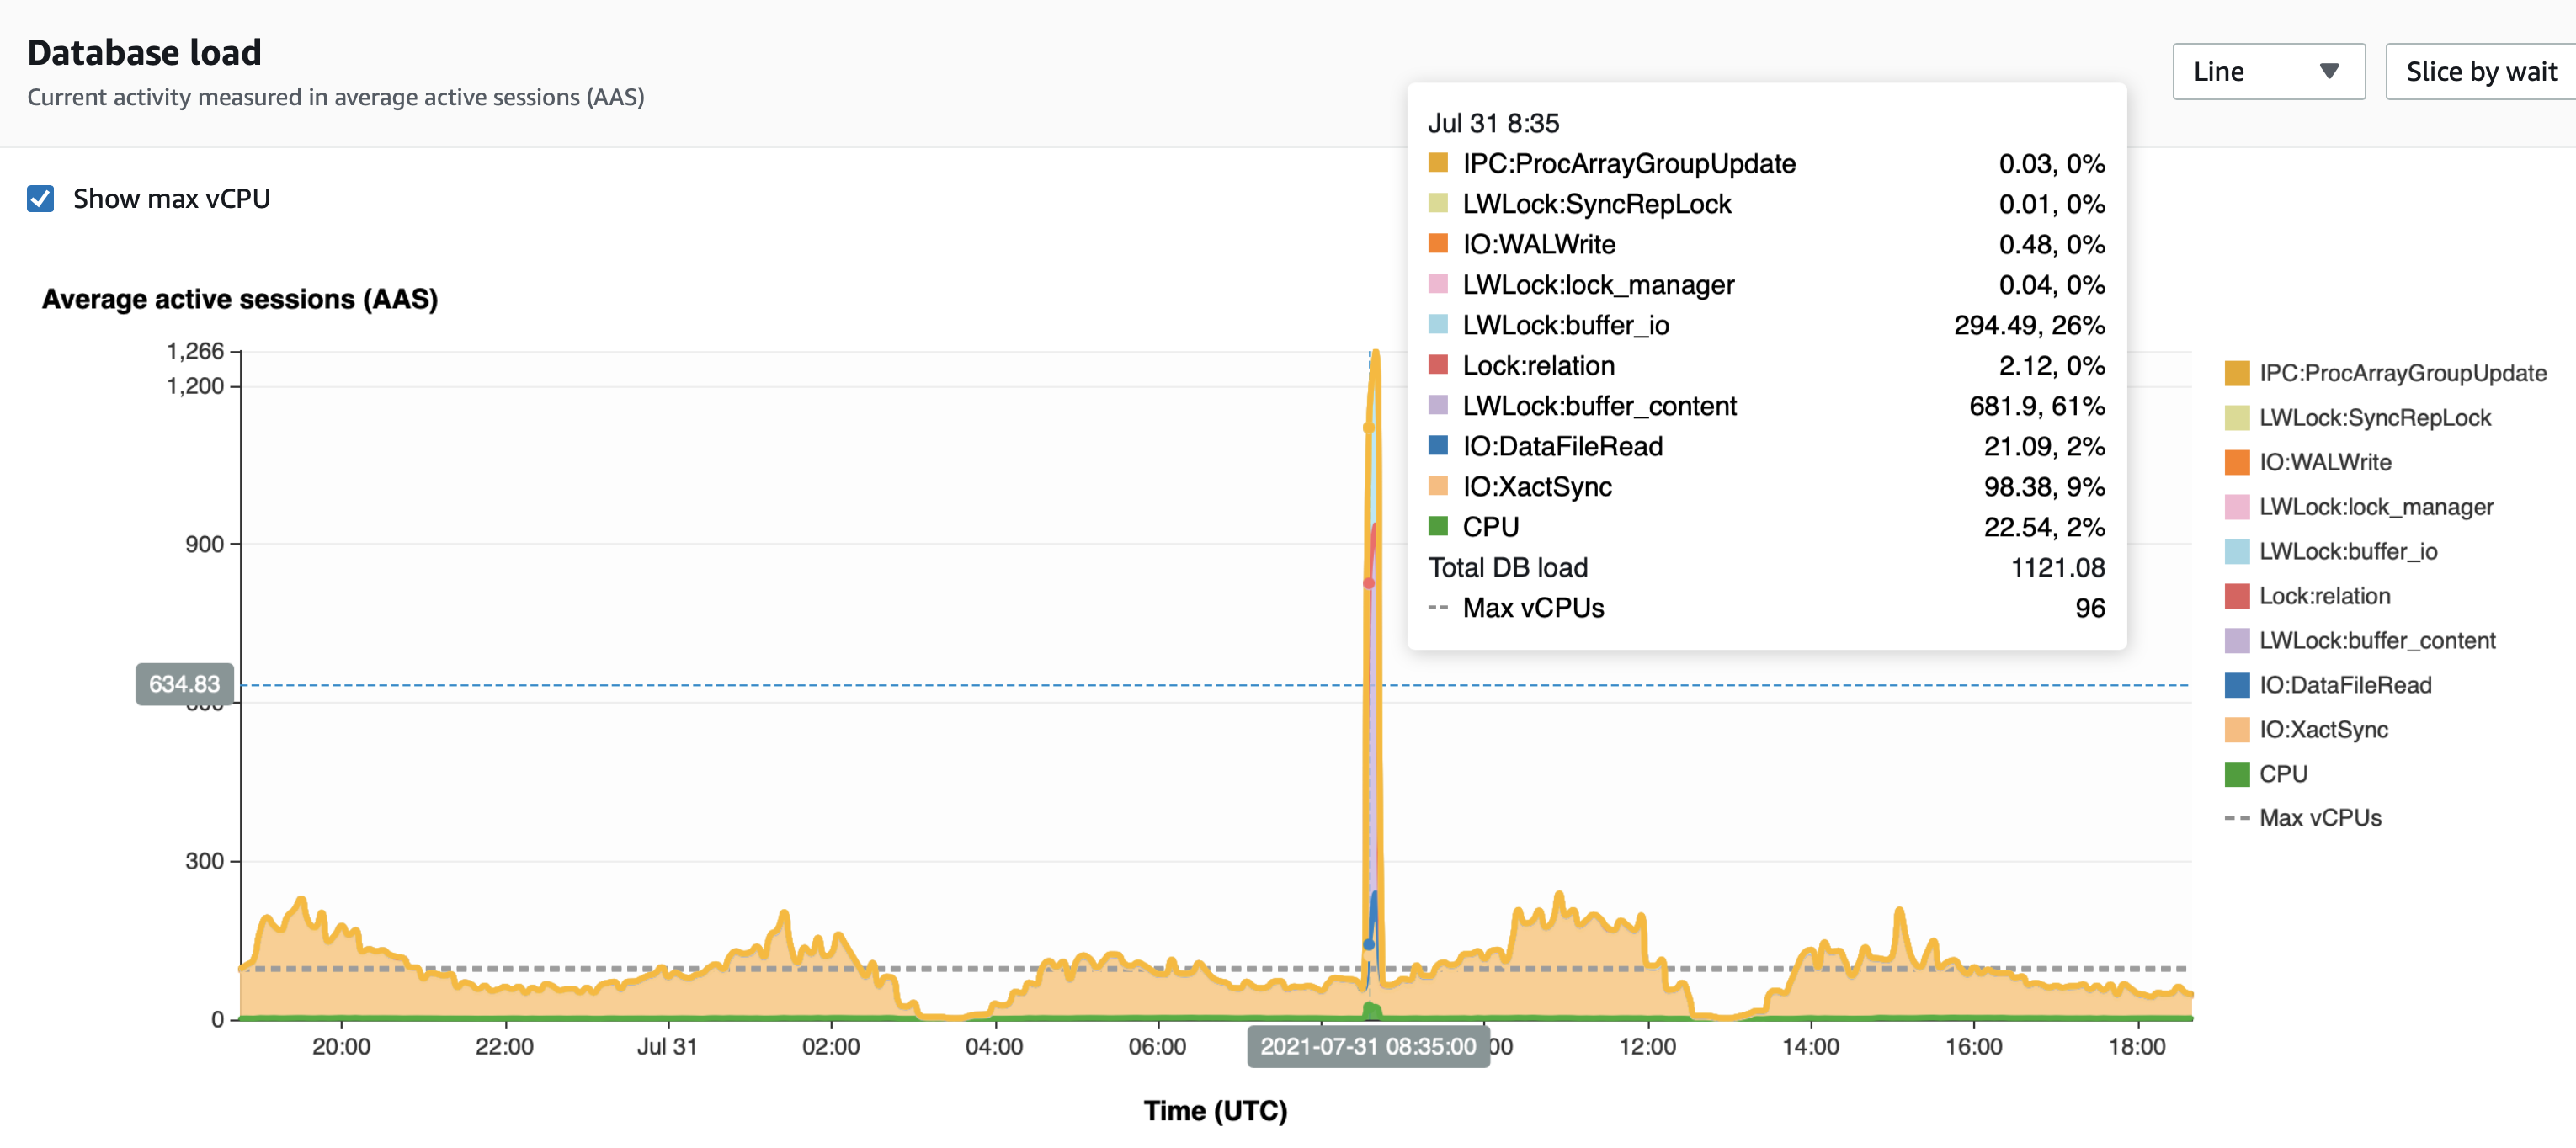
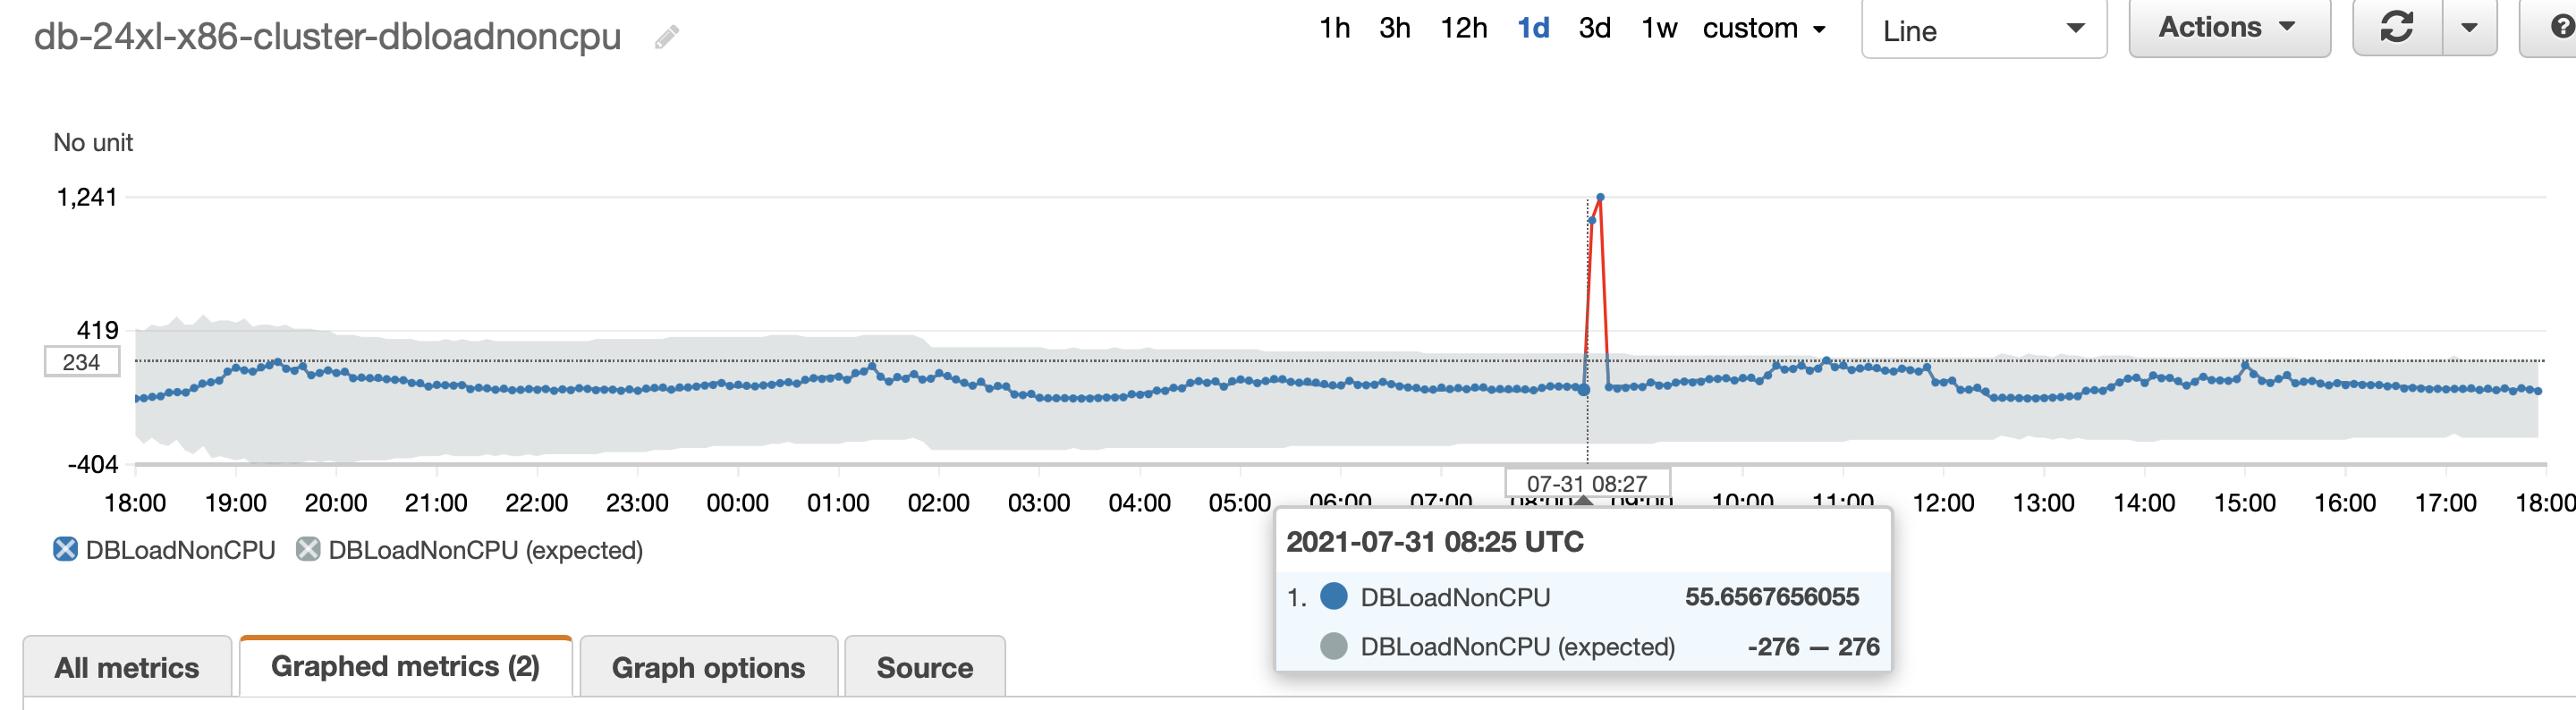
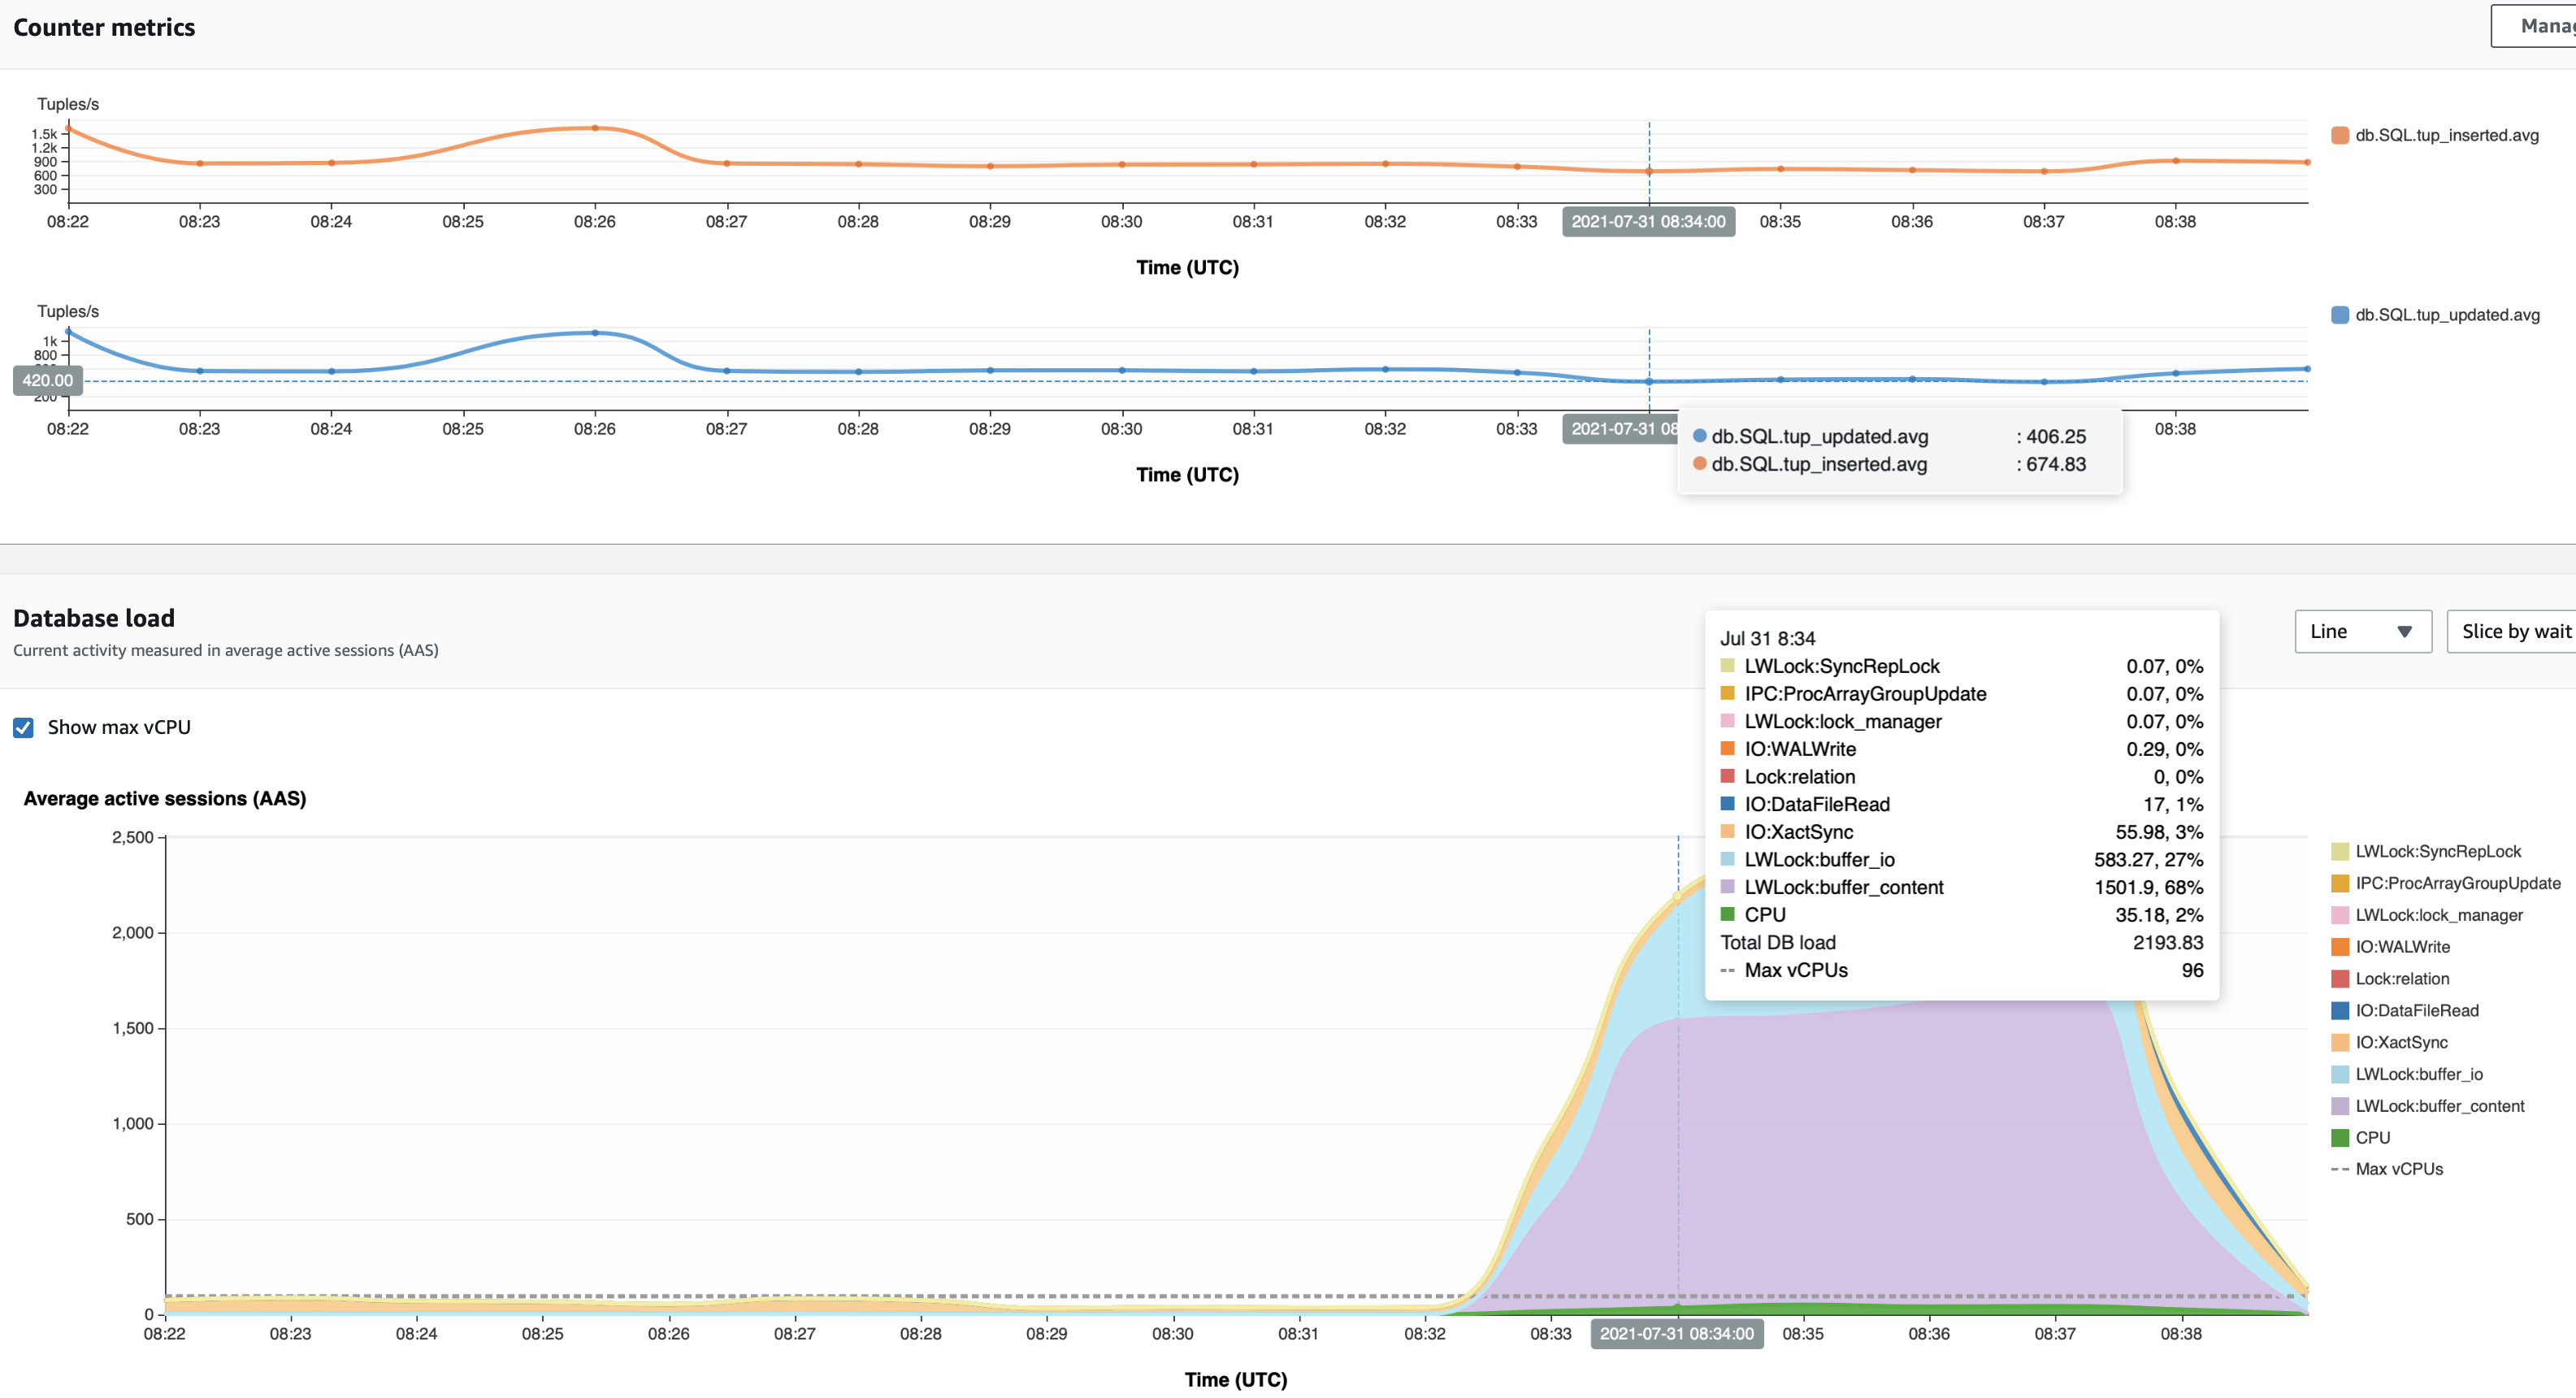
The following screenshot shows a spike in buffer content locks that started at 8:40 UTC, but the anomaly detection algorithm discovered a growing number of DB load on non-CPU at 8:25 UTC.
In the following screenshot, the insert and update throughput reduced from 580 updates/second to 406 updates/second and from 776 inserts/second to 674 inserts/second. The throughput returned to its expected value at 8:40.
Reduce application hot data that contributes to buffer_content locks
Now we know how to identify buffer_content lock contention. In this section, we propose two ideas for minimizing buffer_content locks. The first is to fit the relation size to the primary (read/write) instance memory limits by reducing the number and relation sizes and partitioning the data. The second is to control the number of connections to the databases as more connection processes increase the concurrency on a data block and consume system resources.
Fit the relations size to the primary instance memory
You can fit the relations size to the primary (read/write) instance memory limits to allow the hot working set to live in memory to avoid disk I/O.
PostgreSQL considers foreign keys, indexes, and tables as relations. Frequent relation writes (SQL inserts, updates, and deletes) by one session locks the data page in memory and increases the likelihood of another session to wait in order to read/write the same data page. For example, foreign keys validation after a row deletion or updating a BTree index after updating a value of the indexed column.
PostgreSQL loads pages within tables and indexes from storage to a shared buffer pool in memory. When the used table or index doesn’t fit the shared buffer pool, the primary instance reads from the storage, which takes more time and increases the likelihood of buffer_content locks of the indexed column. Therefore, we recommend removing redundant foreign keys and indexes as well as using partial indexes to avoid nullable indexes.
Additionally, you can partition your tables to allow the hot working set to live in memory and avoid disk I/O.
Table partitioning splits the logical table into smaller physical pieces to improve inserts and updates or queries (foreign keys) that access a single partition. For example, updating a recent transaction timestamp with a partitioned table scans only the relevant partition instead of scanning the entire table or index. We focus on a declarative range partitioning where the table is partitioned into ranges defined by a key column like the recent transaction timestamp example.
Partitioning also simplifies the data churning from OLTP to OLAP systems such as Amazon Redshift to control the total table size. For that, PostgreSQL 14 allows you to detach the partition from the table as an online command with no locks involved. Further, Amazon Aurora PostgreSQL-Compatible Edition supports the Partition Manager (pg_partman) extension. pg_partman is a PostgreSQL extension that helps you to manage your time series table partition sets, including automatic management of partition creation and runtime maintenance.
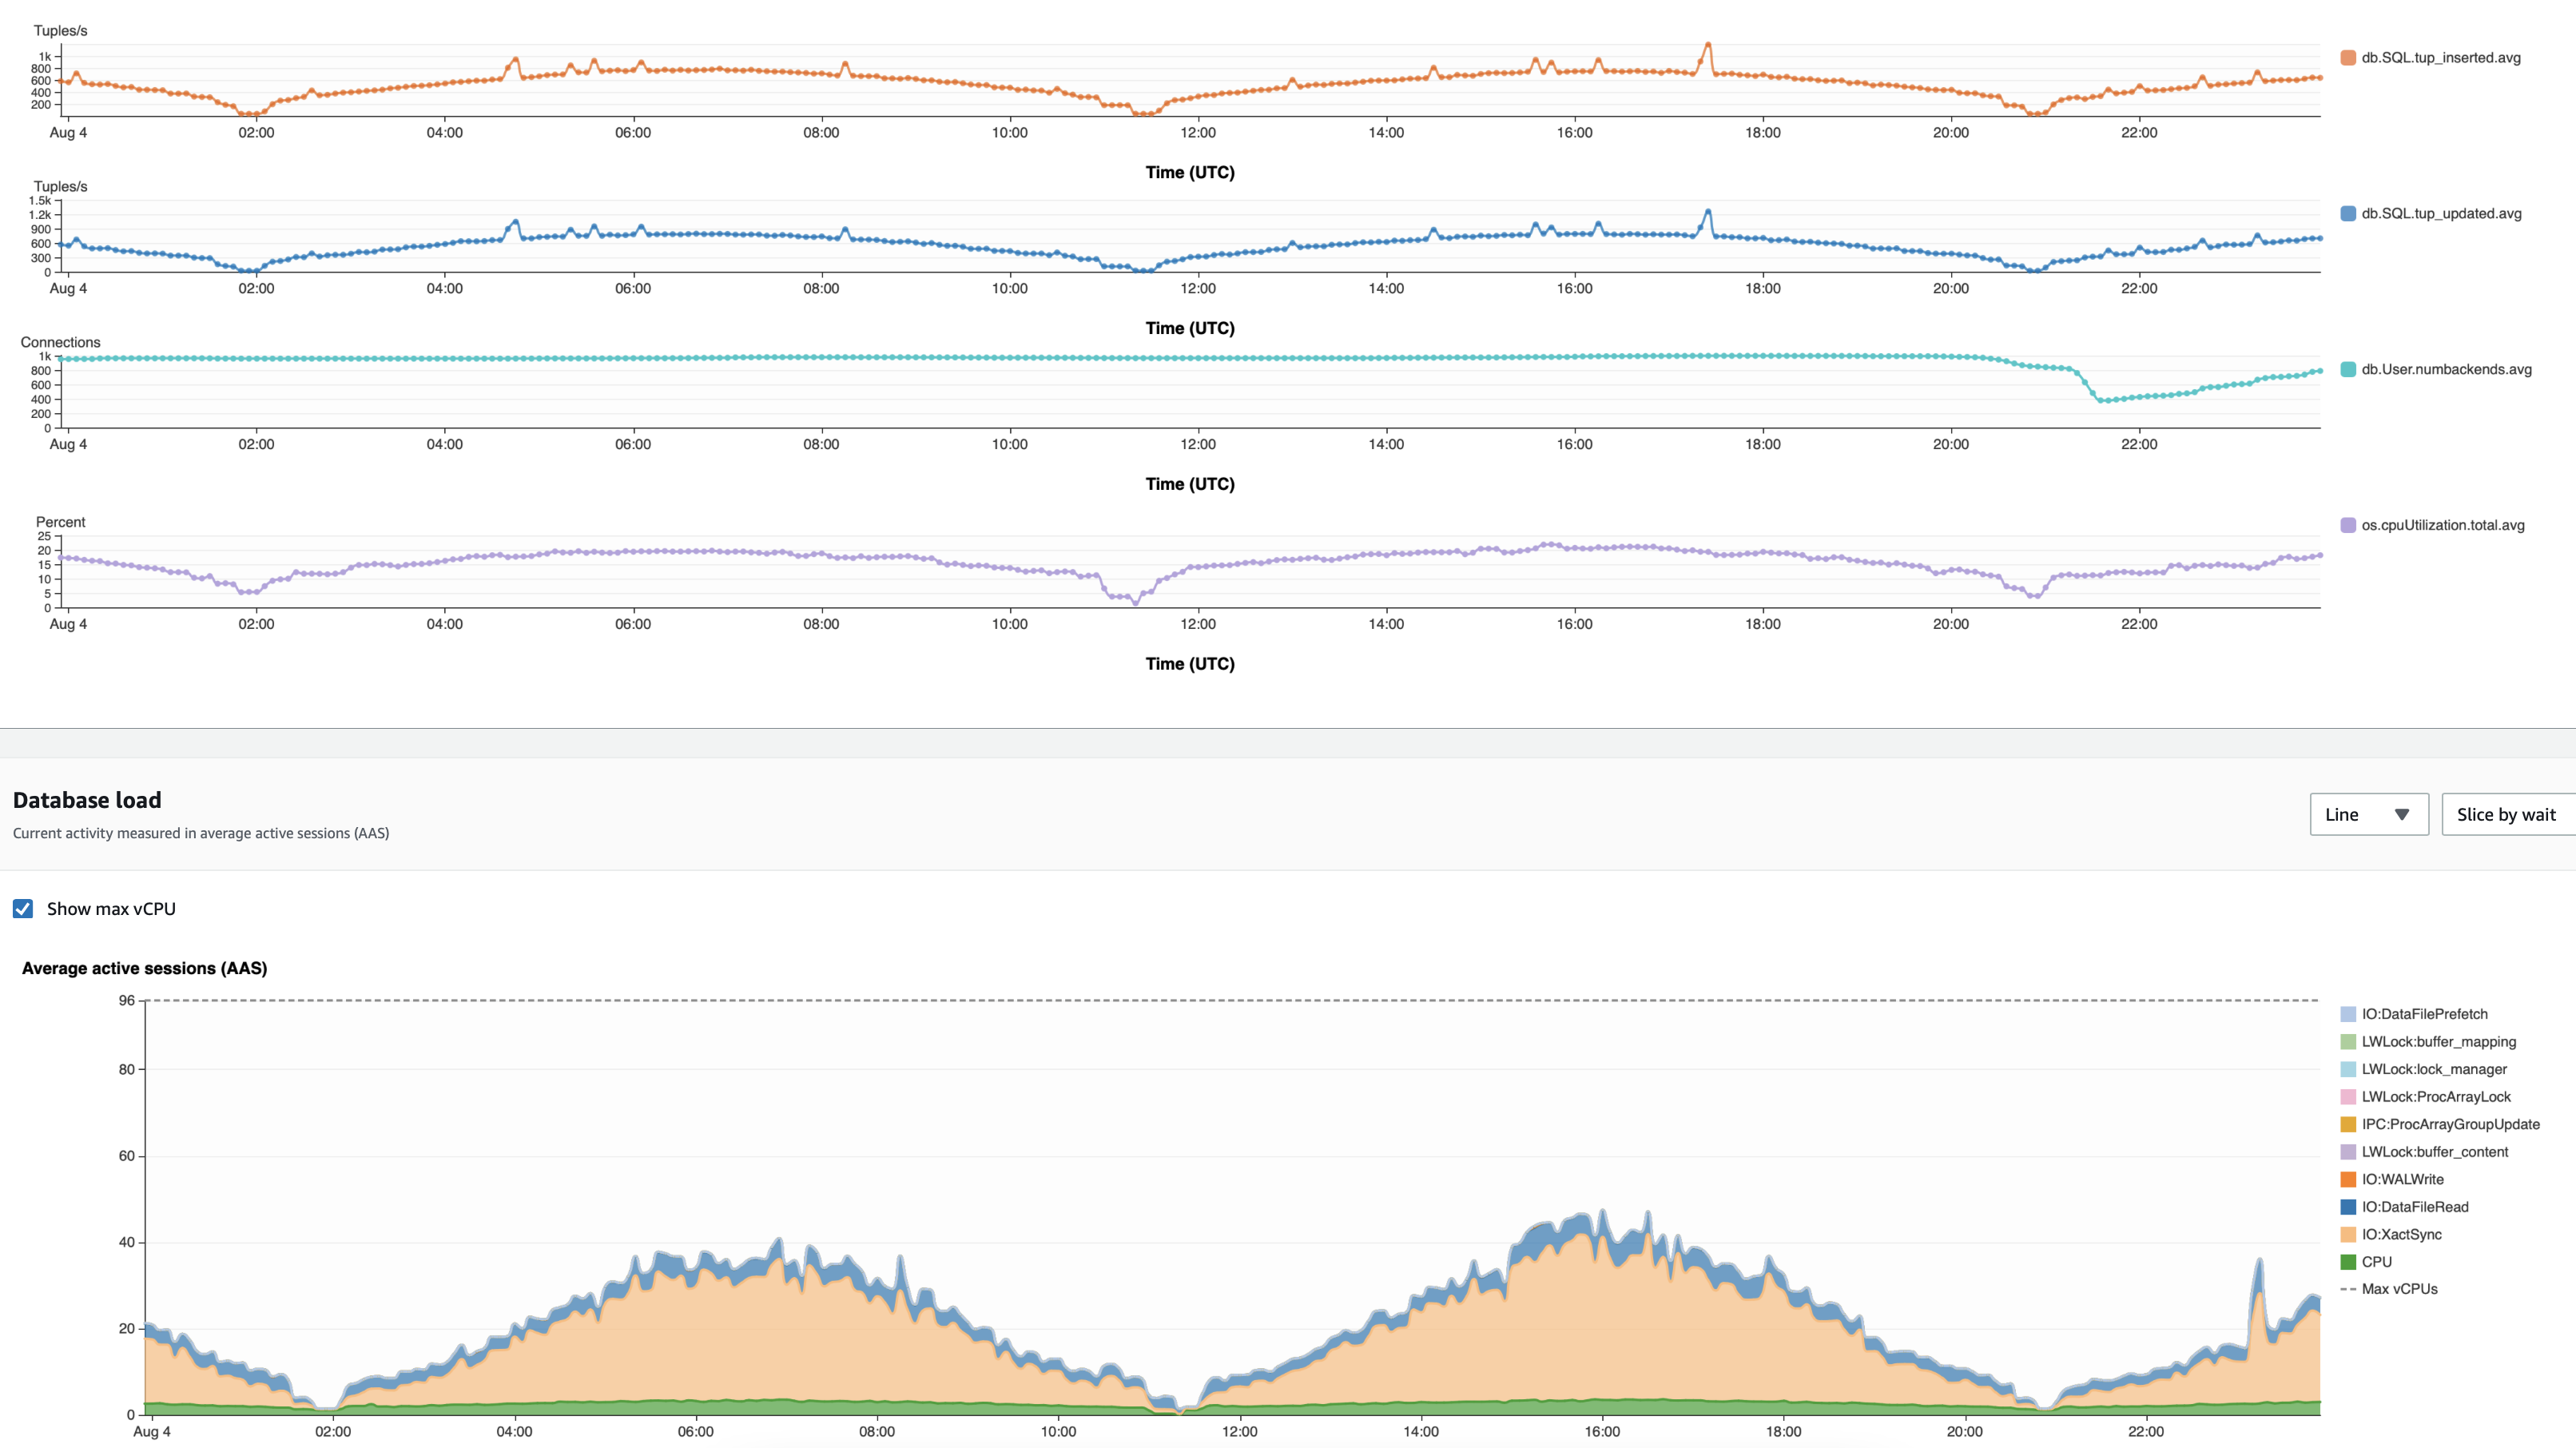
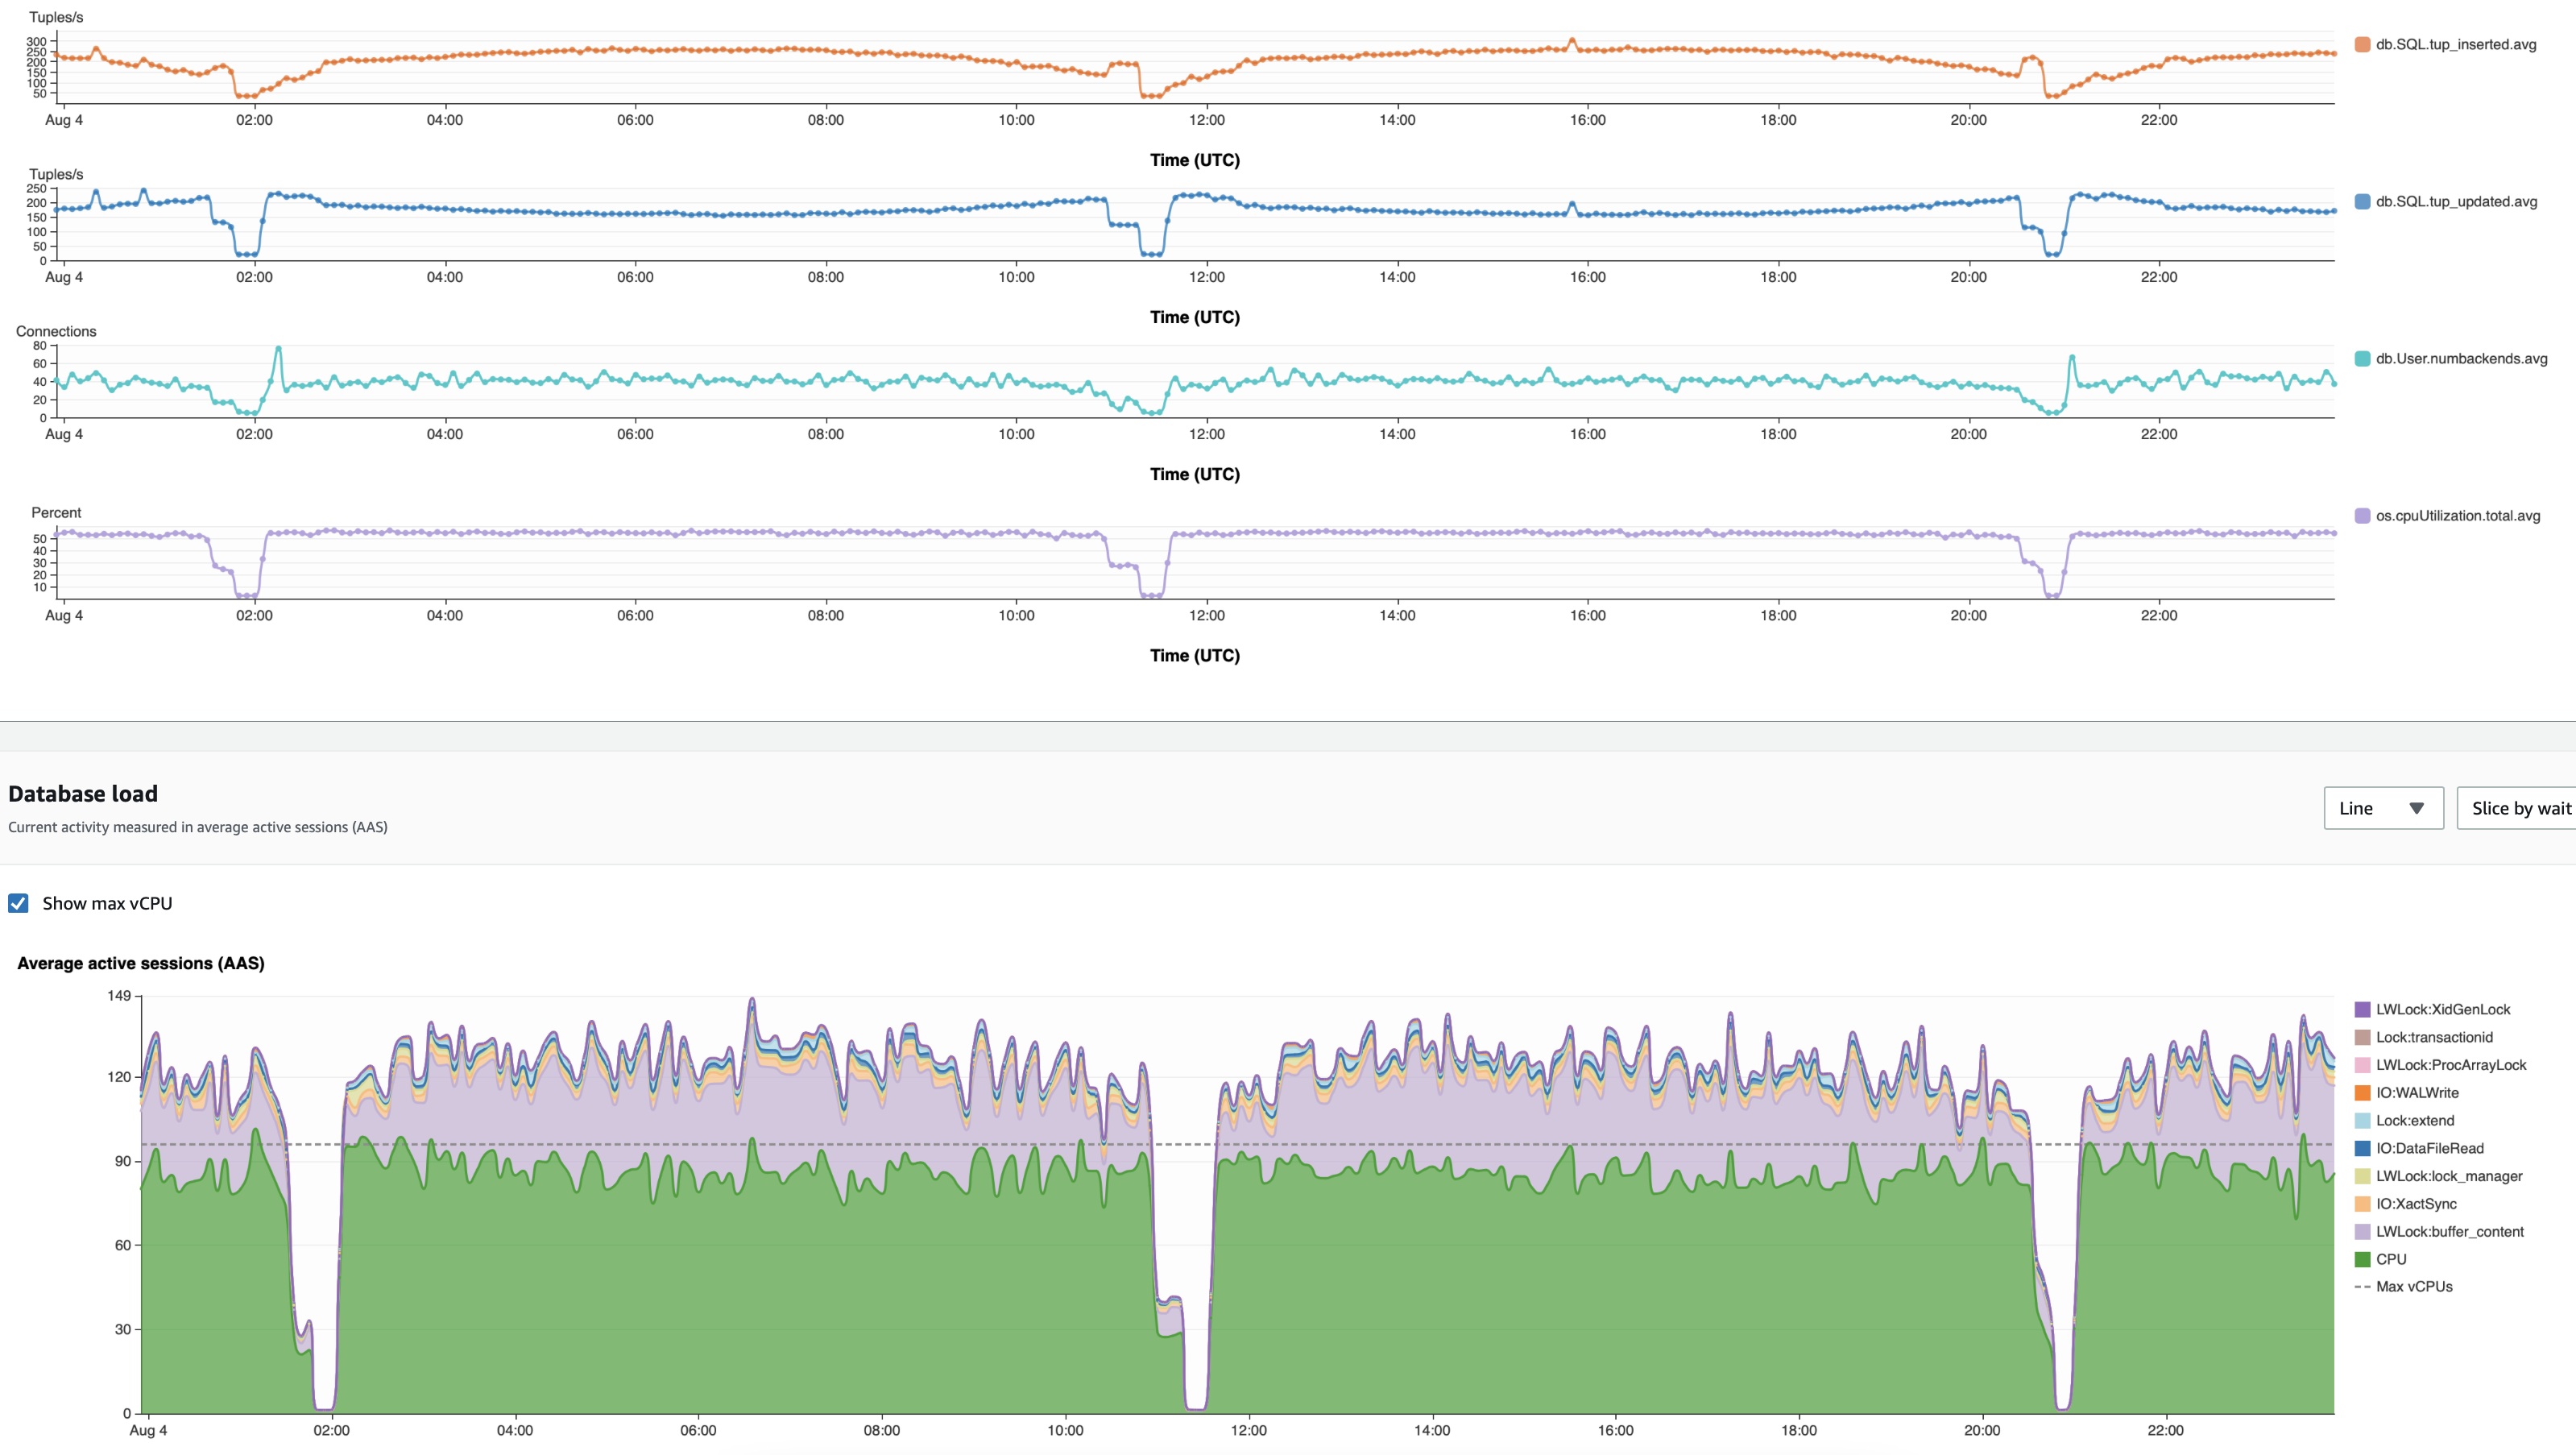
In the following test, we run a load of a positive sine wave of 2,500 inserts and 6,000 updates at peak with 17 TB in two configurations: a partitioned table to 1 TB and a non-partitioned table denoted by part-db and non-part-db, respectively. The non-partitioned database manifested buffer_content LWLocks that impacted the insert and update throughput. You can observe the drops in inserts and updates at 01:00 and 04:00.
The partitioned table database (part-db) didn’t exhibit any buffer_content locks like the non-partitioned table database for the same insert and update throughput and load pattern.
Manage the connection to the database
Connection management to the database is critical to database performance because of the cost of forking a process for a new connection. The child process takes care of activities such as logging, checkpointing, stats collection, and vacuuming. For more information, see Resources consumed by idle PostgreSQL connections.
Application platforms offer dynamic connection pools, which define minimum and maximum and dynamically open and close connections per the application demand. We noticed a correlation between a high number of connections to the database, CPU usage, and the number of buffer_contnet LWLocks. For example, we loaded an Aurora PostgreSQL db.r5.24xlarge database with a positive sine wave of 700,000 inserts/second and 500,000 updates/second. We used two configurations: the first with PGBouncer, which limits that maximum of backend connections to 1,000, and a second configuration that connected the application directly to the database and was bounded by the application’s dynamic needs.
The following screenshot depicts the PGBouncer case. The throughput remains 780 inserts/updates per second during peak. The CPU usage trends with the insert/update throughput and remains 20% at peak.
The following experiment relies on the application needs to allocate the required connections. The maximum number of connections grows to 70 connections at peak and the CPU usage reaches 55%, double from the PGBouncer case. Finally, the number of wait events on buffer_content LWLocks is 24% of the total wait event compared to 0% when connections are static and pre-allocated by PGBouncer.
Finally, we tried to scale down the allowed connections using PGBouncer and noticed a decrease of buffer_content LWLocks and less CPU usage.
Conclusion
In this post, we showed you how to overcome rapid growth challenges in PostgreSQL databases with buffer_content LWLocks by limiting the required hot data to the writer’s memory capacity. In addition, using static connection allocation reduces the writes concurrency that contributes to buffer_content locks. We also offered tips to reduce the locks with table partitioning. We are eager to hear from you about similar challenges you experienced with your PostgreSQL database. Please drop us a comment in the comment section below or create an issue in the simulator code sample.
About the Authors
Yahav Biran is a Solutions Architect in AWS, focused on game tech at scale. Yahav enjoys contributing to open-source projects and publishes in the AWS blog and academic journals. He currently contributes to the K8s Helm community, AWS databases and compute blogs, and Journal of Systems Engineering. He delivers technical presentations at technology events and works with customers to design their applications in the cloud. He received his PhD (Systems Engineering) from Colorado State University.
Sami Imseih is a Database Engineer specialized in PostgreSQL at AWS. Sami has been overseeing mission critical database environments for over a decade. Since 2019, Sami has been helping customers achieve success with database migrations to Amazon RDS for PostgreSQL.
Read MoreAWS Database Blog