

The observability of metrics is a key factor for a successful operations team, allowing for increasingly effective visualizations, analysis, and troubleshooting. Google Cloud works with third-party partners, such as Grafana Labs, to make it easy for customers to create their desired observability stack leveraging a combination of different tools. More than two years ago, we collaborated with Grafana Labs to introduce the Cloud Monitoring plugin for Grafana. Since then, we’ve continued collaborating with Grafana to make lots of improvements to the experience.
As part of this collaborative effort, we’re excited to announce new features such as popular dashboard samples, more effective troubleshooting with deep links, better visualizations through precalculated metrics, and more powerful analysis capabilities.
Let’s take a closer look at each of the new features:
1. Sample dashboards for Google Cloud services
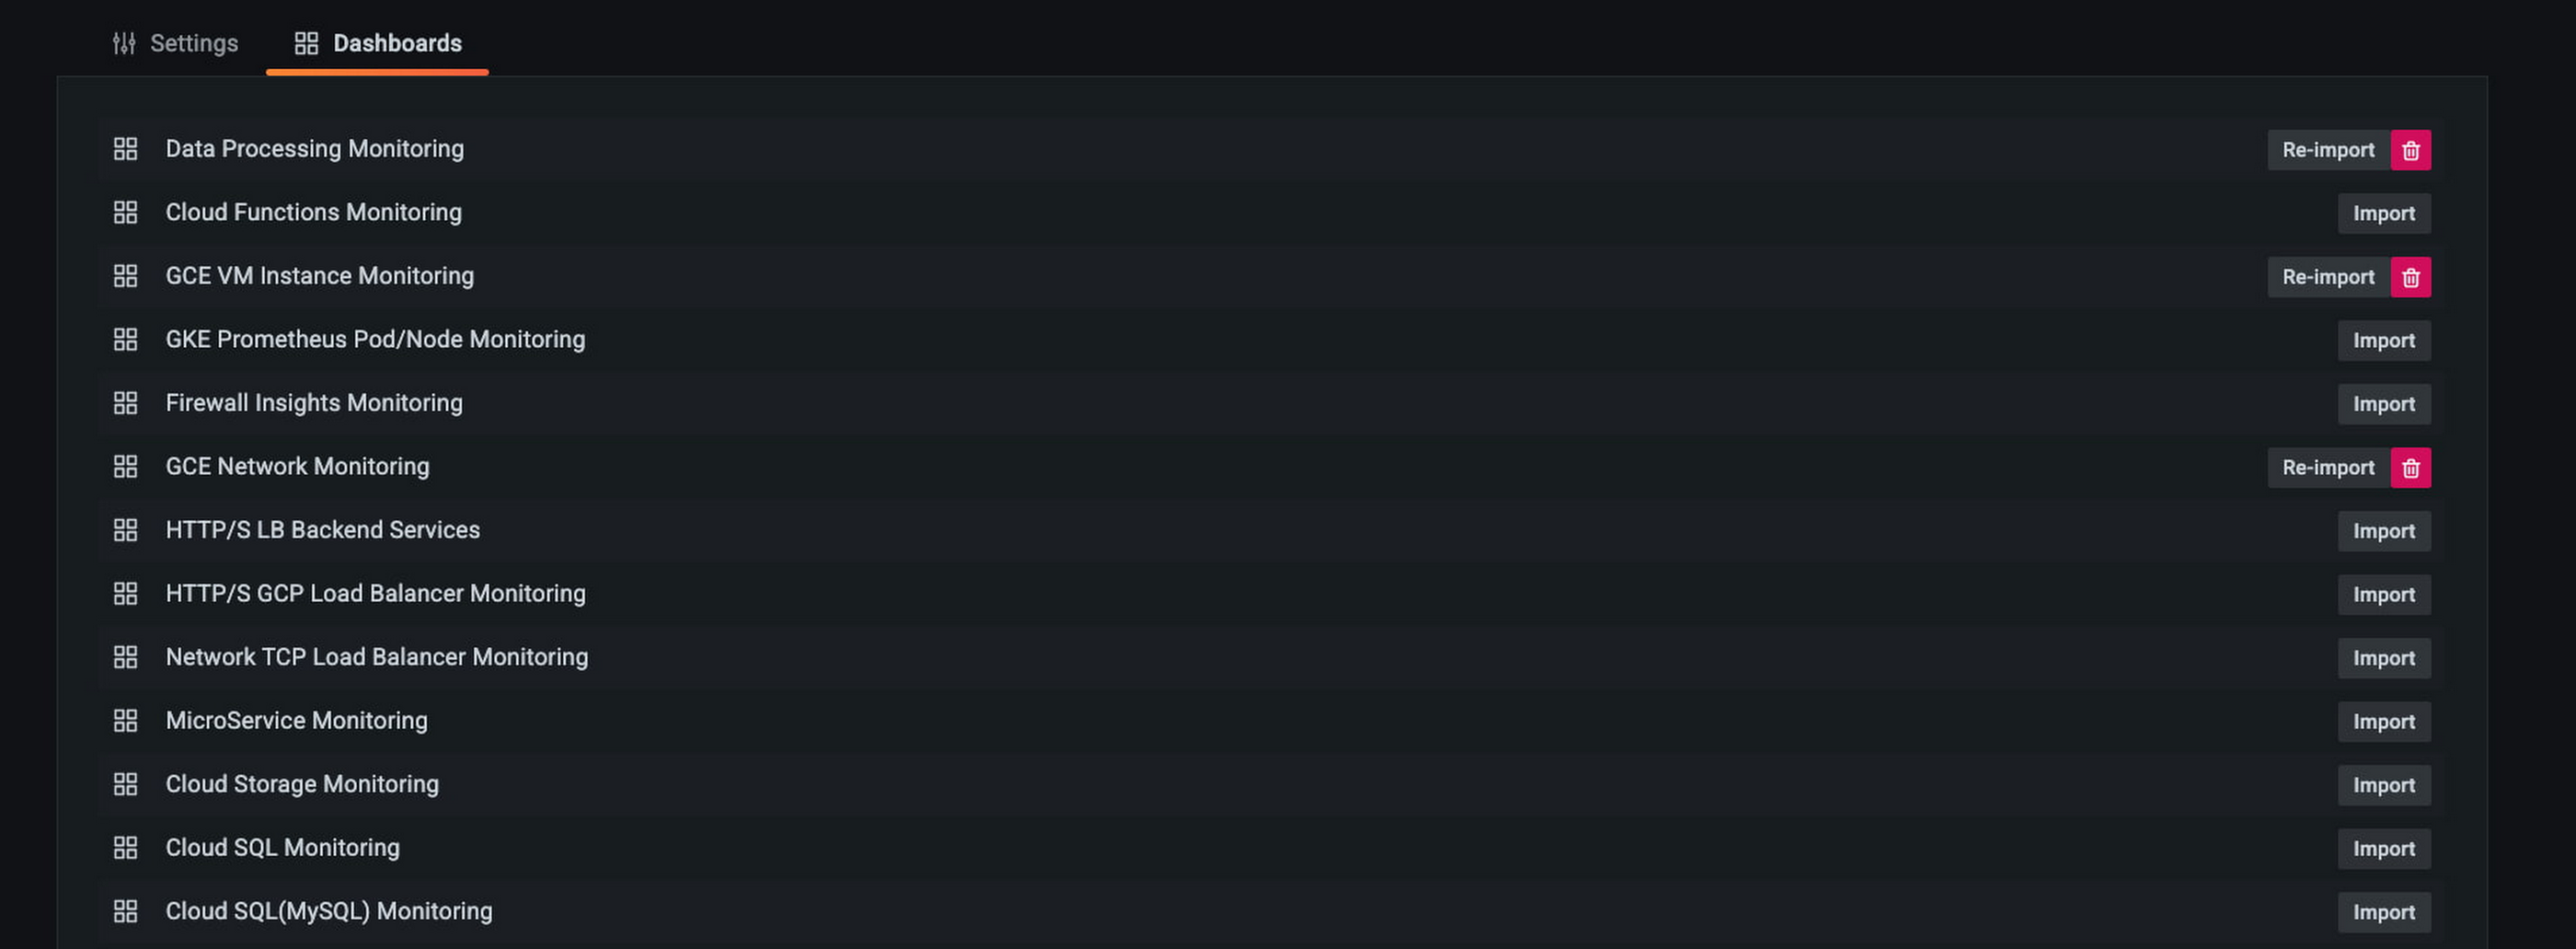
It’s always easier to modify than creating from scratch! We introduced the 15 most popular sample dashboards from Google Cloud Monitoring dashboard samples library on github and converted these dashboards into a Grafana-compatible format. They are ready to install from Grafana in just one click. With this sample library, you can easily import a sample, apply it to a test project, edit it and save it as needed.
2. Deep link to Google Cloud Monitoring metrics explorer
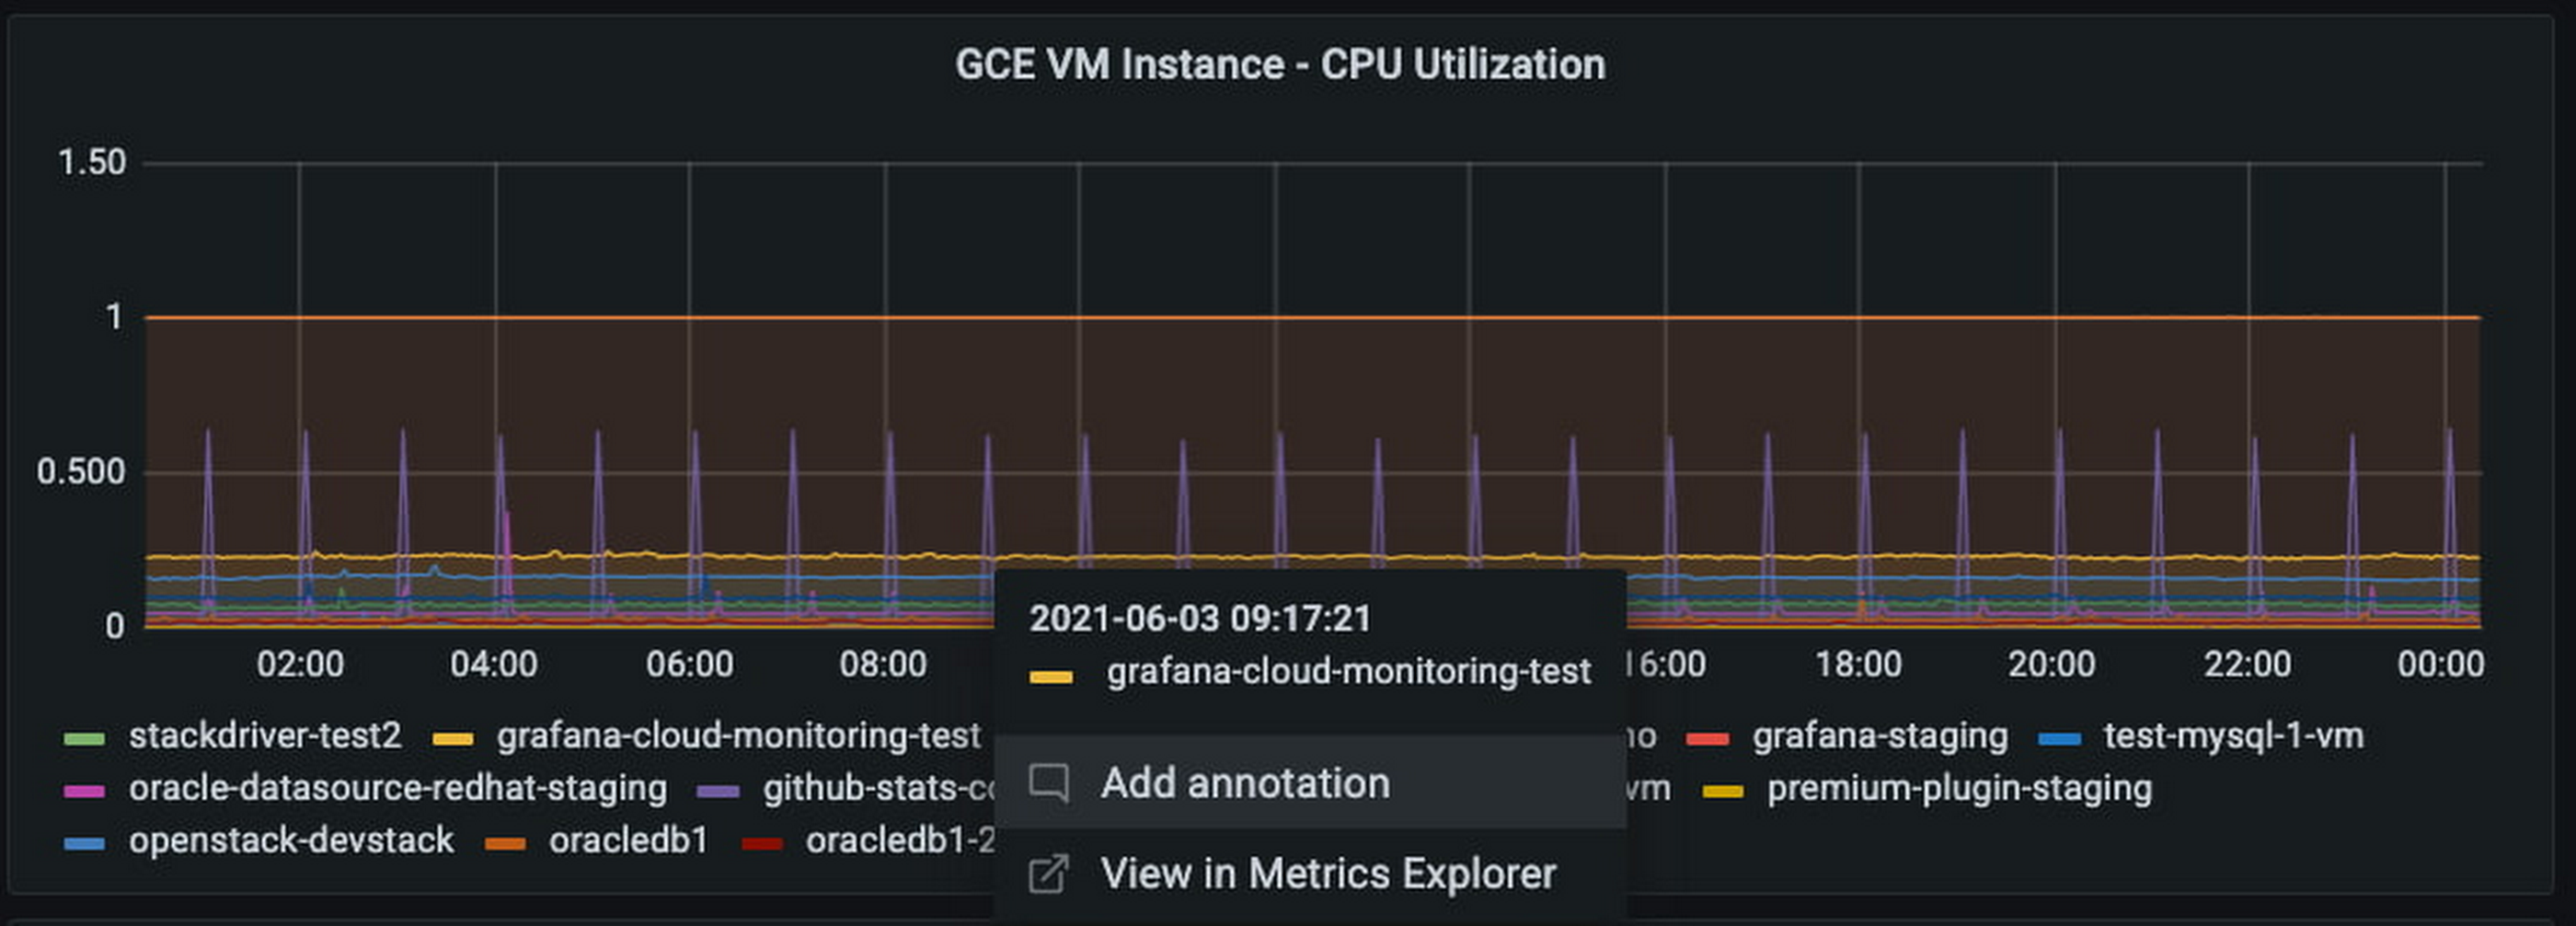
Sometimes you need to switch between your Grafana interface and the Google Cloud Console for troubleshooting. When that happens, it’s easy to lose context, and it can be hard to locate your time-series data. We introduced deep linking to Cloud Monitoring metrics explorer on Grafana’s chart to help. You can easily log into the Cloud Console through deep linking and land right on the time series that you want to investigate.
3. Improved query interface that aligns with new dashboard creation flow
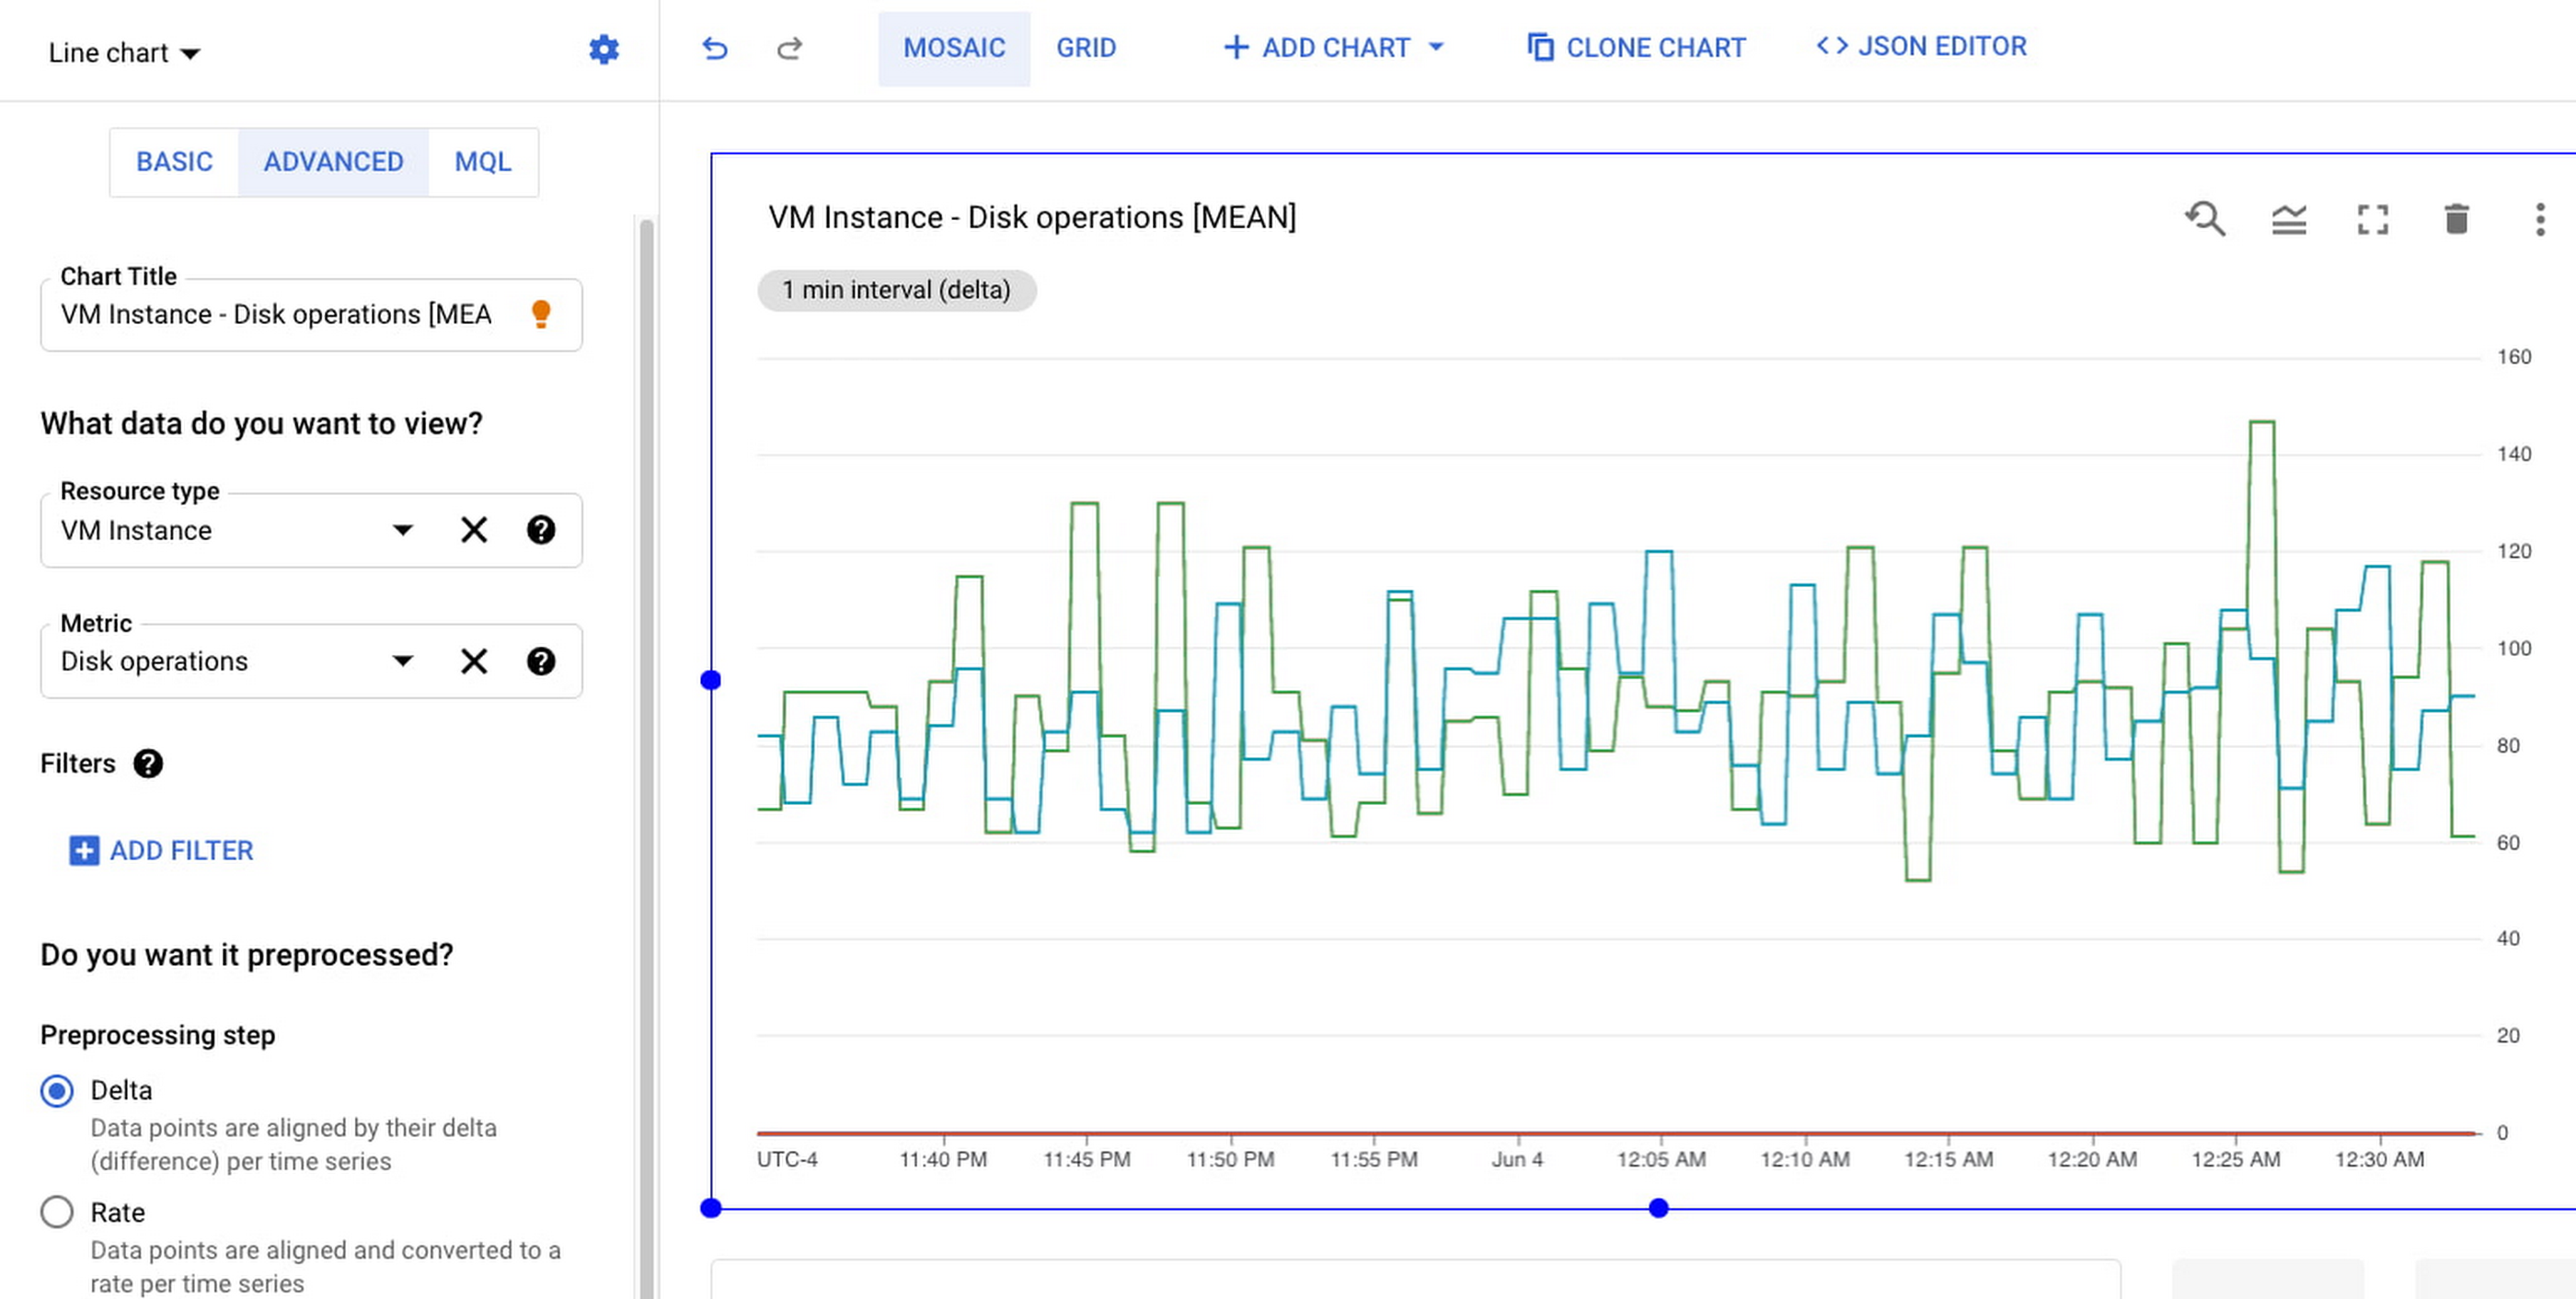
Last year, Cloud Monitoring got an improved dashboard creation flow, including a new way to preprocess delta and cumulative metrics kinds. You now have options to preprocess delta metrics by their rate, and you can also select to view cumulative metrics either as rate or as delta.
With these options you can choose to visualize your data by its original format or in a format that is easily transformed into a rate or a change in value.
4. New Monitoring Query Language (MQL) interface
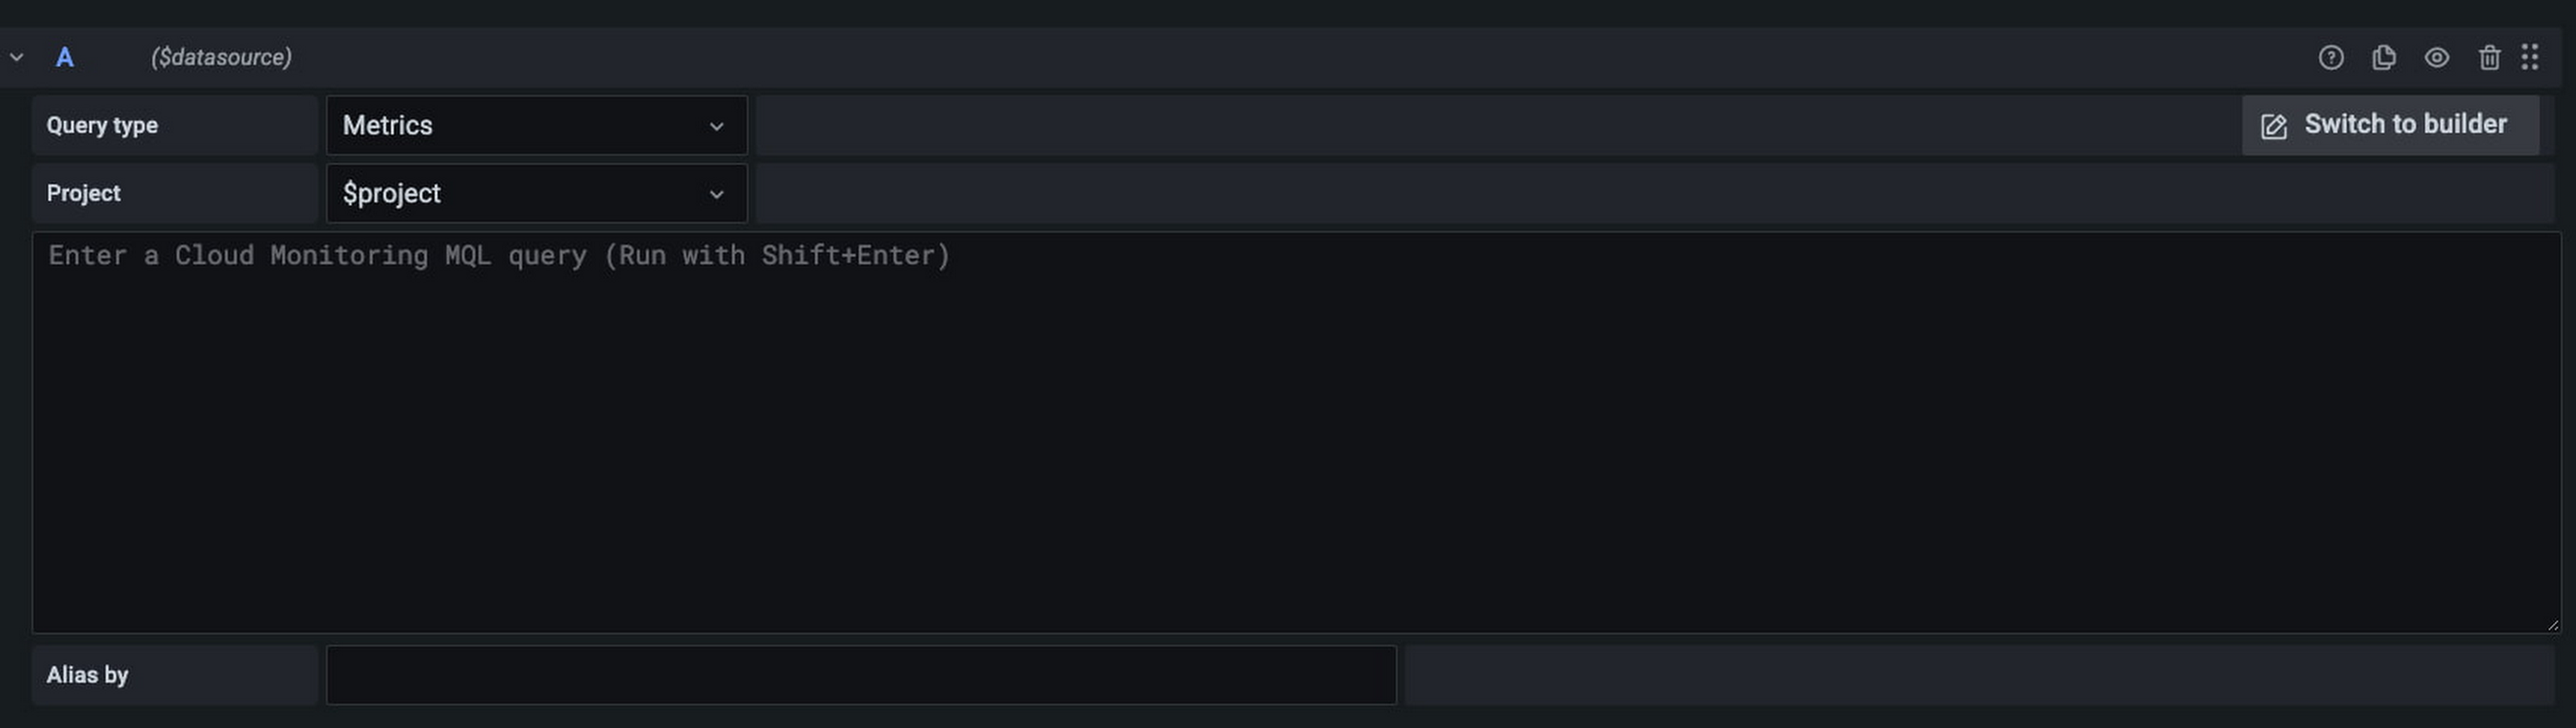
Cloud Monitoring’s MQL became generally available last year, making it easier to perform advanced calculations. We also enabled the MQL editor on the Grafana plugin so you can run your existing MQL query from the Grafana interface directly.
Get Started Today
If you use both Grafana and Google Cloud, you can get started adding Google Cloud Monitoring as a data source for your Grafana dashboards. We look forward to hearing from you about what other features you would like to see so please join us in our discussion forum to ask questions or provide feedback.
Cloud BlogRead More